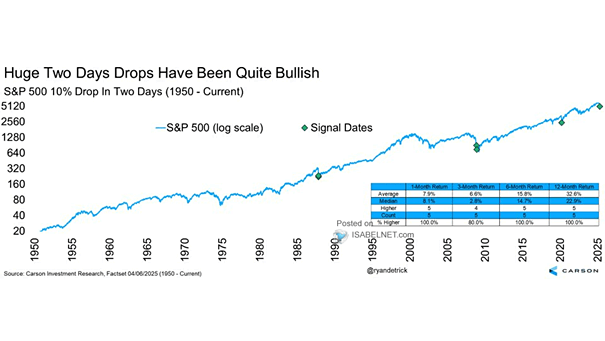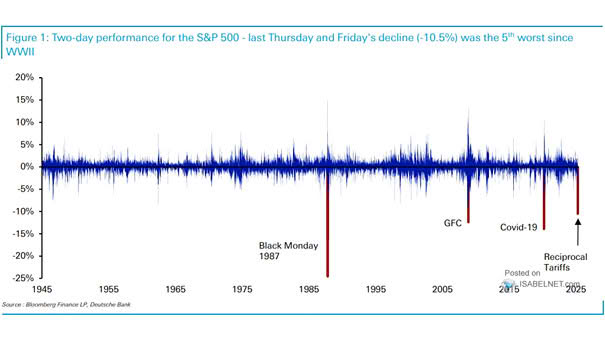
Two-day Performance for the S&P 500
Two-day Performance for the S&P 500 The two-day decline of 10.5% in the S&P 500 last Thursday and Friday marked its fifth-worst drop since World War II. The turmoil is likely to persist as long as there are no concrete signs of tariff reductions or de-escalation in trade tensions. Image: Deutche Bank