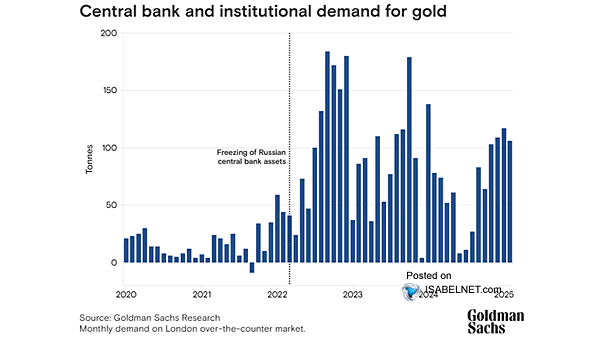
Central Bank and Institutional Demand for Gold
Central Bank and Institutional Demand for Gold Goldman Sachs expects ongoing strong demand from central banks—especially those in emerging markets—to continue boosting gold prices through 2025. Central bank gold purchases have risen fivefold since 2022. Image: Goldman Sachs Global Investment Research