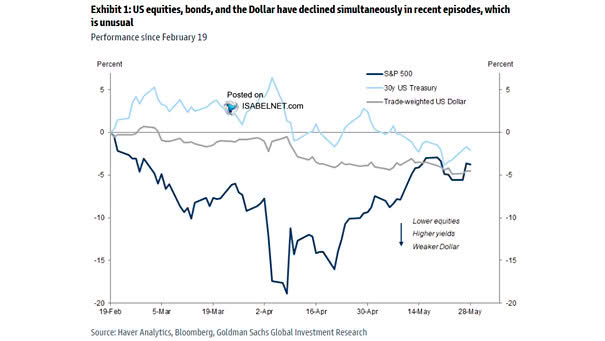
Performance – S&P 500 vs. 30-Year US Treasury vs. Trade-Weighted U.S. Dollar
Performance – S&P 500 vs. 30-Year US Treasury vs. Trade-Weighted U.S. Dollar The simultaneous decline of U.S. equities, bonds, and the dollar is rare—especially during periods of market stress— and signals a potential shift in global investor sentiment and the structural underpinnings of U.S. financial markets. Image: Goldman Sachs Global Investment Research