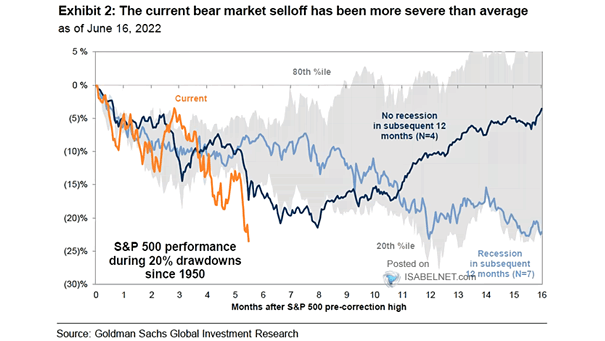
Median S&P 500 Performance Around Drawdowns Close to or Larger than 20% Since 1950
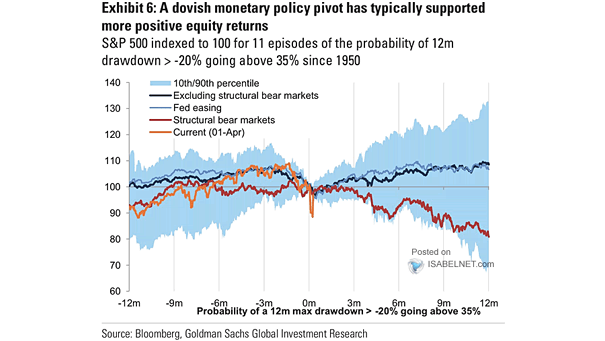
Median S&P 500 Performance Around Drawdowns Close to or Larger than 20% Since 1950 In the absence of recession, short-lived market drawdowns are often followed by strong recoveries, offering attractive returns to investors who stay the course rather than selling in panic. Image: Goldman Sachs Global Investment Research