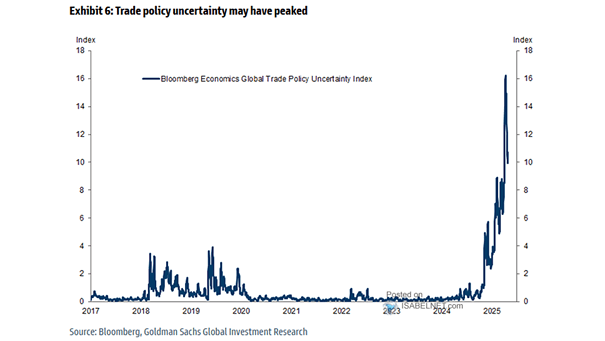
Trade Policy Uncertainty
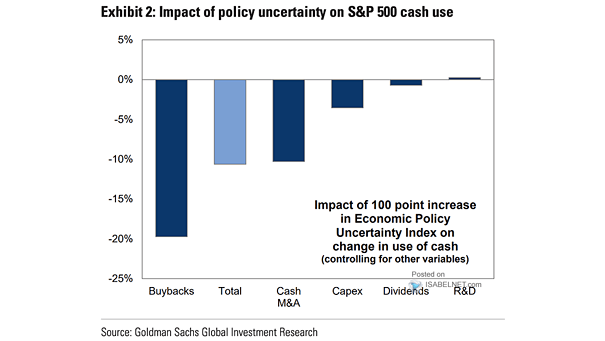
Trade Policy Uncertainty When trade policy uncertainty peaks, the S&P 500 often posts positive returns. Markets tend to over-discount risks during uncertain periods, and relief rallies are common once worst-case scenarios are avoided or resolved. Image: Goldman Sachs Global Investment Research