Cash on the Sidelines in Money Market Mutual Funds
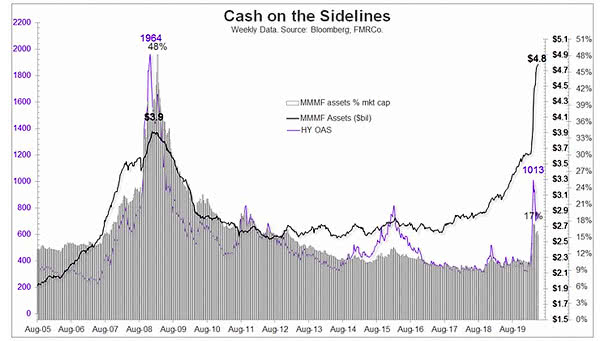
Cash on the Sidelines in Money Market Mutual Funds How much cash is sitting in money market mutual funds, waiting to come back to the market? $4.8 trillion, which is about 16% of market capitalization. Image: Fidelity Investments