Gold and Negative Yielding Debt
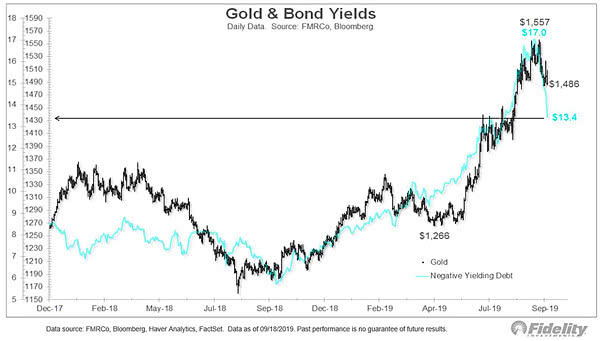
Gold and Negative Yielding Debt This chart shows the strong correlation between gold and market capitalization of global negative yielding debt. Negative global yields are a support for gold.
Gold and Negative Yielding Debt This chart shows the strong correlation between gold and market capitalization of global negative yielding debt. Negative global yields are a support for gold.
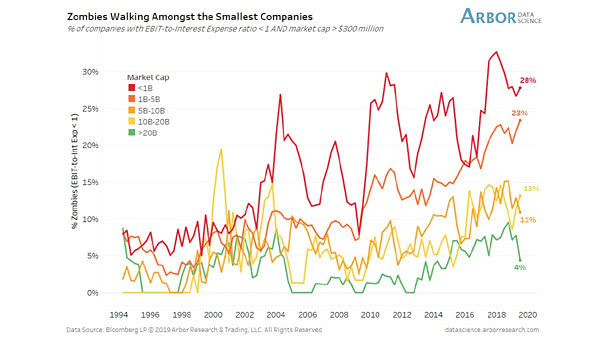
Zombies Walking Amongst the Smallest Companies Interesting chart showing the rise of zombie companies and their market capitalization. Image: Arbor Research & Trading LLC
FAQ Most Frequent Questions and Answers Membership Why Subscribe? Stay on the top of the US stock market Isabelnet subscription prepares you for what is ahead with advanced forecasting models.. Exclusive short- and long-term forecasts Our models alert our members with US market insight no one else have. Keep up to date with…

S&P 500 Buybacks S&P 500 companies continue robust buybacks at record levels in 2025, demonstrating strong capital deployment, with repurchases projected to exceed $1 trillion this year. Image: Deutsche Bank Asset Allocation
Returns – Magnificent Seven vs. European Banks Since January 2022, European banks have outperformed U.S. mega-cap tech stocks—a notable achievement considering the longstanding dominance of American tech giants in global markets. Image: Goldman Sachs Global Investment Research
U.S. Equities – S&P 500 Equal Weight vs. S&P 500 The performance divergence of the S&P 500 index and its equal-weighted version highlights how a select group of high-flying, large-capitalization stocks is overshadowing broader market weaknesses. Image: Bloomberg
S&P 500 Index The market-capitalization weighted S&P 500 index has significantly outperformed other asset classes since the beginning of the year. Image: Morgan Stanley Wealth Management