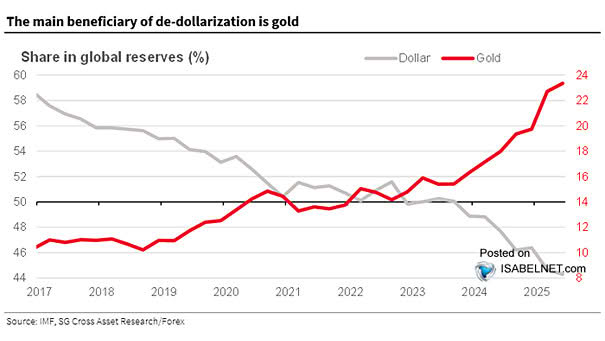
Central Bank Balance Sheets as % of GDP
Central Bank Balance Sheets as % of GDP The Federal Reserve appears as the central bank with the highest room to increase its balance sheet. Image: Deutsche Bank
China – Required Reserve Ratio vs. M1 Money Supply Growth The People’s Bank of China slashed the reserve requirement ratio for most financial institutions, but M1 money supply growth is currently near the lowest. This is not good news for GDP growth. Image: Jeroen Blokland
Total Allocated Exchange Reserves by Currency The U.S. dollar represents 61% of all central bank foreign reserves. And the total value of all currencies held in foreign exchange reserves is almost $11 trillion. Image: howmuch.net
Atlanta Fed GDPNow U.S. Real GDP Estimate The GDPNow model estimate for U.S. real GDP growth is 0.7% for 2023:Q1. Image: Federal Reserve Bank of Atlanta
Probability of U.S. Recession Calculated from the Yield Curve The probability of a U.S. recession in 12 months, calculated from the yield curve, increased to 63.3% in January. Image: Federal Reserve Bank of Cleveland
Flexible and Sticky Inflation Sticky inflation (core services) continues to increase while flexible inflation (core goods) is declining. Image: Federal Reserve Bank of St. Louis
U.S. Recession – Philadelphia Fed’s State Coincident Indexes – Number of States with Negative Growth Recession risks are still increasing in the United States. Image: Federal Reserve Bank of St. Louis
New York Fed GDP Nowcast The New York Fed’s GDP Nowcast stands at 3.79% for 2021:Q3. Image: Federal Reserve Bank of New York Click the Image to Enlarge
Inflation – TIPS and Equity Sector Fund Flows Strong fund inflows into TIPS, materials, energy and financials. Will the Federal Reserve let the U.S. economy run hot? Image: Deutsche Bank Asset Allocation
U.S. Labor Market Distributions Spider Chart The U.S. labor market distributions spider chart shows broad labor market developments. Image: Federal Reserve Bank of Atlanta