Length of Economic Expansion and U.S. GDP Growth
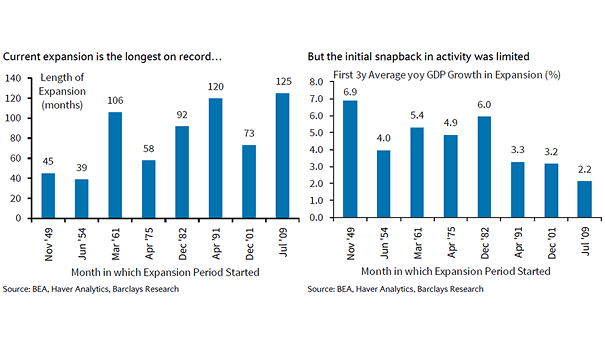
Length of Economic Expansion and U.S. GDP Growth The current business cycle is the longest and weakest expansion. Image: Barclays Research
Length of Economic Expansion and U.S. GDP Growth The current business cycle is the longest and weakest expansion. Image: Barclays Research
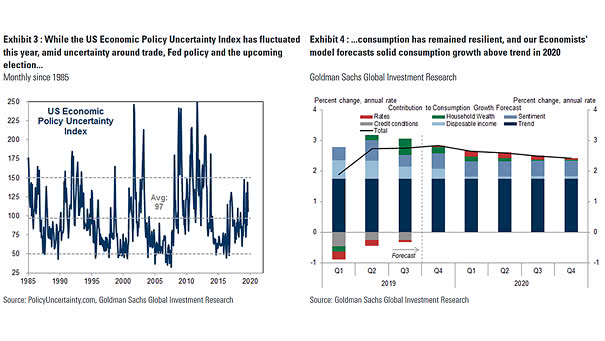
U.S. Economic Policy Uncertainty Index and Consumption Growth Forecast Goldman Sachs economists’ model forecasts solid consumption growth above trend in 2020, despite policy uncertainty. Image: Goldman Sachs Global Investment Research

European Economic Slowdown – Real GDP Growth 2018Q4 Is Europe’s slowdown severe? Well, this great chart shows real GDP growth in 2018Q4. Image: European Economic Snapshot
Consensus EPS Growth Estimates Consensus forecasts suggest a resilient corporate sector, with S&P 500 EPS expected to grow by 7% in 2025 and accelerate to 14% in 2026, reflecting optimism despite economic uncertainties. Image: Goldman Sachs Global Investment Research
Performance – Value vs. Growth The U.S. market is experiencing outperformance in growth sectors driven by innovation and strong earnings, whereas value sectors dominate outside the U.S. due to slower earnings growth and differing economic dynamics. Image: Goldman Sachs Global Investment Research
The Conference Board Leading Economic Index (LEI) for the U.S. In May, the U.S. Leading Economic Index (LEI) fell by 0.1%, suggesting that economic growth in 2025 may slow significantly compared to 2024. Image: The Conference Board
Citi Economic Surprise Index vs. 10-Year U.S. Treasury Yield Economic momentum-reflected in growth data and surprises relative to forecasts-continues to be the main force driving U.S. Treasury yields. Image: Paulsen Perspectives
Wage Growth vs. Fed Funds Rate When wage growth lags behind the fed funds rate, it is interpreted as a sign that monetary policy is restrictive, as borrowing costs exceed the pace of income growth, potentially dampening consumer spending and economic activity. Image: Yahoo Finance
Global Economy – GDP Growth Projections The International Monetary Fund projects global economic growth of 2.8% in 2025 and 3.0% in 2026, reflecting a subdued outlook shaped by persistent trade tensions and high policy uncertainty. Image: International Monetary Fund
Contributions to Annualized U.S. PCE Growth The U.S. stock market’s recent underperformance is expected to reduce the wealth effect, turning it from a boost to a drag on consumption and increasing the risk of a broader economic slowdown as consumer spending weakens. Image: Goldman Sachs Global Investment Research
Consensus Estimated Margin Growth Slower economic growth and rising costs are expected to lead to a decline in S&P 500 margin estimates later this year. Image: Goldman Sachs Global Investment Research