Record Money Market Fund Inflows
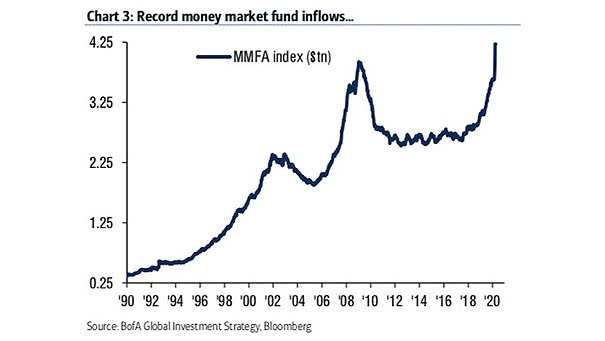
Record Money Market Fund Inflows Money market funds get record inflow, as investors flood into the safety of cash. Image: BofA Global Investment Strategy
Record Money Market Fund Inflows Money market funds get record inflow, as investors flood into the safety of cash. Image: BofA Global Investment Strategy
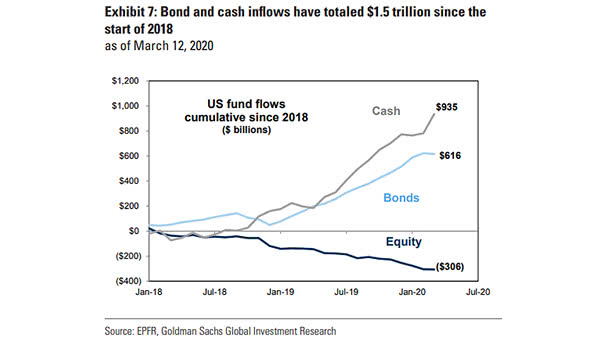
U.S. Fund Flows Cumulative Since 2018 Fear of a recession has led to a record equity outflows and bond & cash inflows in recent years. Image: Goldman Sachs Global Investment Research

U.S. Fund Flows Chart showing the large divergence between flows into equity funds and those into cash and bonds. Image: Goldman Sachs Global Investment Research
Money Market Fund Flows and Probability of Recession Investors move to safe assets by raising their cash holdings, like 2007/2008. This chart suggests that the probability of a recession in the next 12 months is high. Image: Goldman Sachs Global Investment Research
Top Five Companies % of S&P 500 Market Capitalization The S&P 500 is experiencing unprecedented levels of concentration. While the concentration presents potential risks, the fundamentals of the top 5 companies remain strong, with elevated profit margins and robust cash flow generation. Image: Deutsche Bank
S&P 500 Operating Margin After the COVID-19 pandemic, the operating margins of companies in the S&P 500 have returned to a state of normalcy, leading to a positive trend of improved profitability and cash flows for these companies. Image: Morgan Stanley Wealth Management
S&P 500 vs. Top 10 Investors can benefit from the currently wide valuation dispersion by focusing on low beta stocks that have stable cash flows and strong balance sheets. Image: J.P. Morgan Asset Management
Cross-Asset Valuation for the U.S. On an absolute basis, equities look expensive by historical standards, but relative valuations appear attractive, as free cash flow yield and ERP look cheap. Image: Goldman Sachs Global Investment Research
Does Quantitative Easing Affect Valuation? More fundamentally, low interest rates, high margins, low taxes, buybacks & free cash flow drive stocks higher. Image: Fidelity Investments
S&P 500 Payout Ratio Stock buybacks and dividends as a percentage of free cash flow are reaching dangerous levels. Image: MarketWatch
Why Lower Bond Yields Influence the S&P 500? Because lower interest rates push stock market multiples higher. If interest rates are lower, then the value of future cash flows increases, because future cash flows are discounted back at a lower interest rate. So, lower U.S. 10-year yields influence the stock market equity risk premium. On the other…