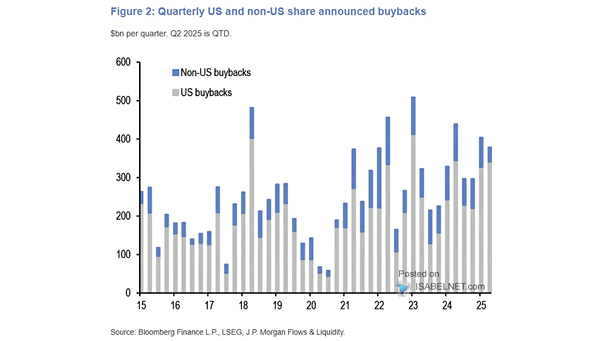
Quarterly U.S. and Non-U.S. Share Announced Buybacks
Quarterly U.S. and Non-U.S. Share Announced Buybacks Strong share buyback announcements from U.S. companies signal their confidence in their financial health and their dedication to boosting shareholder value and stabilizing stock prices. Image: J.P. Morgan