More than 200 Years of US Interest Rates in One Chart
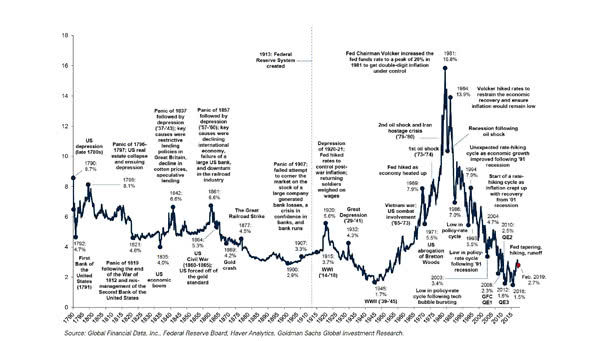
More than 200 Years of U.S. Interest Rates in One Chart This long term chart covers more than two centuries of US interest rates (yield on the U.S. 10-year Treasury). Image: Goldman Sachs Global Investment Research Click the Image to Enlarge