World Population in 2018

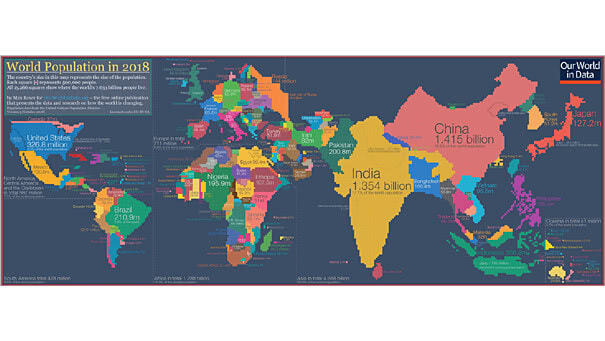
World Population in 2018 Interesting world map: the country’s size represents the size of the population. You may also like “World Population & Demographics – More People Over 65 than Under 5 for the First Time.” Image: Our World in Data Click the Image to Enlarge
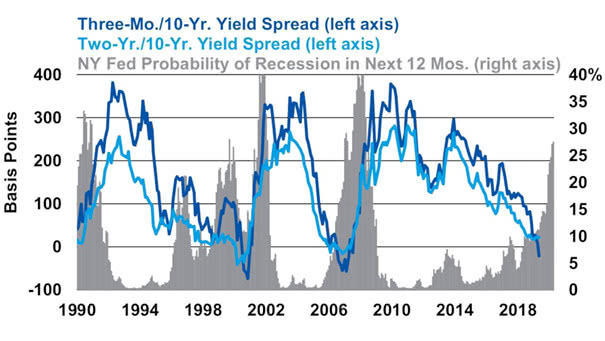
New York Fed Probability of Recession in Next 12 Months since 1990

New York Fed Probability of Recession in Next 12 Months since 1990 When an inverted yield curve occurs, short-term interest rates exceed long-term rates. It suggests that the long-term economic outlookis poor and that the yields offered by long-term fixed income securities will continue to decline. Since 1962, no recession has occurred without an inverted…

Yield Curve Inversion, How Long Until The Recession?

Yield Curve Inversion, How Long Until The Recession? In recent history, once the 10-Year minus 3-Month Treasury yield spread is negative and hits 10 consecutive days, it persists for weeks/months. When an inverted yield curve occurs, short-term interest rates exceed long-term rates. It suggests that the long-term economic outlook is poor and that the yields offered…

What Indicators to Watch for Signs a U.S. Recession Is Coming?

What Indicators to Watch for Signs a U.S. Recession Is Coming? 1) In recent history, a recession occurs about 12 to 18 months after the spread between the 30-year and the 3-month treasury yields turns negative (red arrow). When an inverted yield curve occurs, short-term interest rates exceed long-term rates. It suggests that the long-term…

One of the Best Yield Curves to Predict a Recession is Coming

One of the Best Yield Curves to Predict a Recession is Coming The spread between the 30-year and the 3-month treasury yields is one of the best recession signal of all the yield spreads. In recent history, a recession occurs about 12 to 18 months after the yield curve inverts. When an inverted yield curve…

Yield Curve vs. Real Fed Funds Rate

Yield Curve vs. Real Fed Funds Rate In modern history, every recession was preceded by an inverted yield curve and high real interest rates. When an inverted yield curve occurs, short-term interest rates exceed long-term rates. It suggests that the long-term economic outlook is poor and that the yields offered by long-term fixed income securities will…

Home

Advanced Stock Market Forecast 95% Correlation since 1970 Stock Market Valuation Short- and Long-Term Forecasts Bull and Bear Indicator Equity Risk Premium R² = 0.90 since 1970 For Professionals and Individuals View More Subscribe Now! Check out our Stock Market Forecasting Models “Your results are very interesting” Howard Marks Legendary investor Our Features Five Advanced…