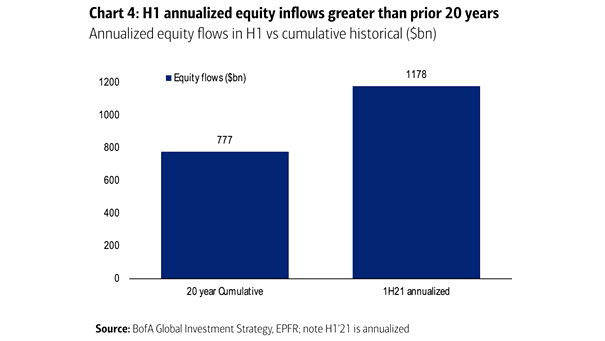
Annualized Equity Flows in H1 vs. Cumulative Historical
Annualized Equity Flows in H1 vs. Cumulative Historical Are equity inflows headed to the moon? Image: BofA Global Investment Strategy
Annualized Equity Flows in H1 vs. Cumulative Historical Are equity inflows headed to the moon? Image: BofA Global Investment Strategy
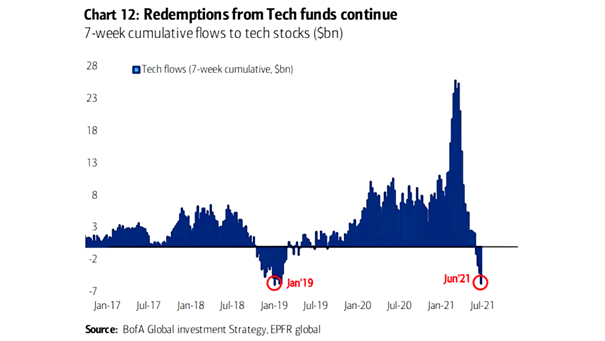
7-Week Cumulative Flows to Tech Stocks Should investors still continue to dump tech stocks in favor of cyclicals? Image: BofA Global Investment Strategy

Housing – House Price Index This is the fourth housing boom since 1970. Image: BofA Global Investment Strategy
ISM PMI vs. S&P 500 Markets tend to lead the macro for most time periods. Image: BofA Global Investment Strategy
Annual Equity Flows % of AUM Equity inflows as a percentage of AUM are very strong year-to-date. Image: BofA Global Investment Strategy
Cyclical Stocks – Regional Banks vs. NYFANG Price Relative Should investors be careful about cyclical stocks? Image: BofA Global Investment Strategy
Annual Equity Flows Equity inflows are very strong year-to-date. Image: BofA Global Investment Strategy
6-Week Cumulative Flows to Tech Stocks Should investors continue to dump tech stocks in favor of cyclicals? Image: BofA Global Investment Strategy
Global Earnings Revision Ratio The global earnings revision ratio is still improving. Image: BofA Global Quantitative Strategy
Inflation – Annualized 3-Month Headline CPI Change Has U.S. headline inflation peaked? Image: BofA Global Investment Strategy
Inflation – Annualized 3-Month Core CPI Change Has U.S. core inflation peaked? Image: BofA Global Investment Strategy