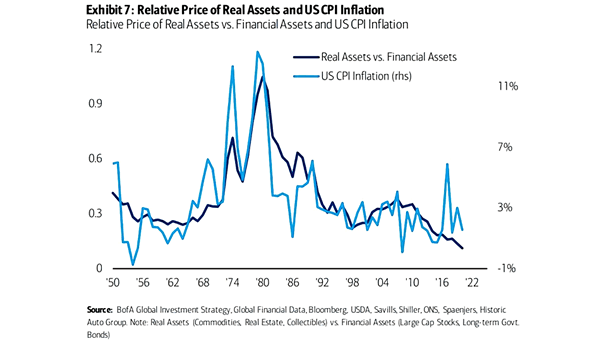
S&P 500 Dividend Futures Curve vs. 2019 Dividends
S&P 500 Dividend Futures Curve vs. 2019 Dividends The dividend futures market may be too negative, as it was the case in 2008. Image: BofA US Equity & Quant Strategy
Record Money Market Fund Inflows Money market funds get record inflow, as investors flood into the safety of cash. Image: BofA Global Investment Strategy
Strategists’ S&P 500 Year-End Targets Despite the extreme volatility, the consensus year-end target for the S&P 500 is now 3,038. Image: CNBC
U.S. High-Yield vs. Investment-Grade and MSCI ACWI ex-US (Leading Indicator) This chart suggests that the ratio of high-yield to investment-grade bond performance is a leading indicator for stocks. Image: BofA Global Investment Strategy
U.S. Equity Market Total Return Volatility and VIX Currently, the monthly volatility of U.S. equities is the highest on record. Image: BofA Global Investment Strategy
Sensitivity of S&P 500 EPS Forecast to Changes in GDP and the U.S. Dollar This table suggests the sensitivity of S&P 500 EPS forecast to changes in GDP and the U.S. dollar. Image: J.P. Morgan US Equity Strategy & Global Quantitative Research
S&P 500 Forward P/E Drawdown This chart puts the S&P 500 forward P/E drawdown into perspective. Image: Scotiabank GBM Portfolio Strategy
Total Returns by Decade History suggests that over a 10-year time horizon, returns are rarely negative. Image: BofA US Equity & Quant Strategy
Weekly Bond Fund Flows This week was the largest week of bond fund outflows ever. Image: BofA Global Investment Strategy
Percent of BofA Bear Market Signposts Triggered 79% of BofA bear market signposts were triggered on October 10, 2018 vs. 53% currently. Image: BofA US Equity & US Quant Strategy