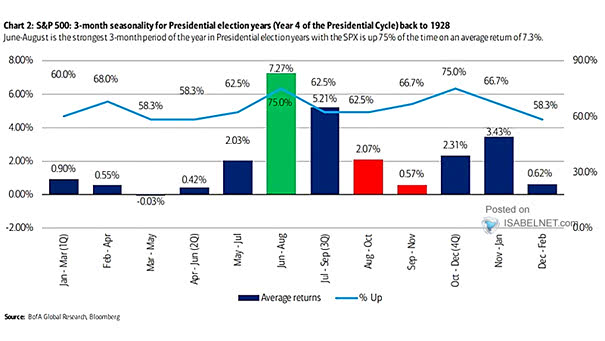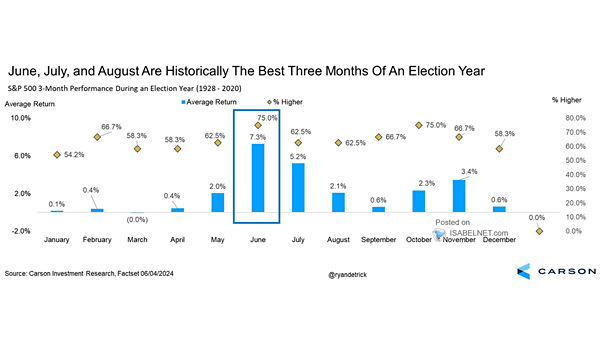
S&P 500 3-Month Performance During an Election Year
S&P 500 3-Month Performance During an Election Year In Presidential election years, June to August stands out as the strongest 3-month period of the year. The S&P 500 has been up 75% of the time, with an average return of 7.3% since 1928. Image: Carson Investment Research