Nasdaq Composite Relative to CSI 300
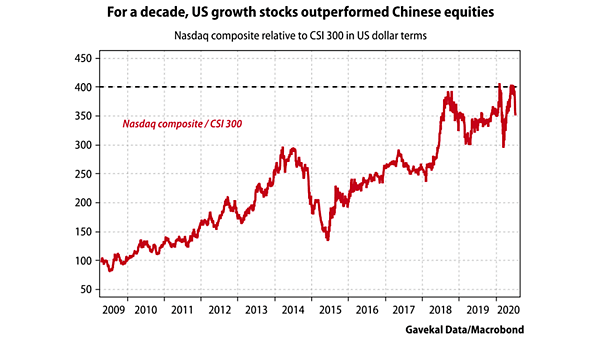
Nasdaq Composite Relative to CSI 300 Will U.S. growth stocks continue to outperform Chinese equities? Image: Gavekal, Macrobond
Nasdaq Composite Relative to CSI 300 Will U.S. growth stocks continue to outperform Chinese equities? Image: Gavekal, Macrobond
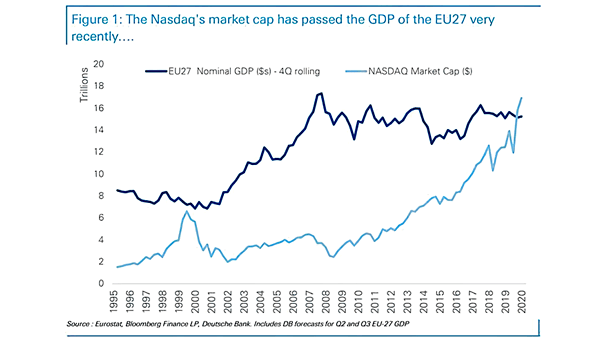
EU27 Nominal GDP vs. Nasdaq Market Capitalization Is tech in a bubble? The Nasdaq market capitalization is now bigger than the nominal GDP (in U.S. dollars) of the European Union’s 27 member countries. Image: Deutsche Bank

Performance – S&P 500 vs. Nasdaq Will the Nasdaq continue to outperform the S&P 500? Image: The Daily Shot
Nasdaq 100 Optimism Index Pullback on the horizon? The Nasdaq 100 Optimism Index’s Average is the highest for the last 20 years. Image: Axios Visuals
Valuation – Nasdaq Internet Forward P/E vs. Total Fed Assets Chart suggesting the close relationship between the Nasdaq Internet forward P/E and total Fed assets. Image: Lohman Econometrics
Nasdaq Composite Members Above 50 Day SMA vs. Nasdaq Composite Index Chart suggesting that Nasdaq internals are losing momentum. Image: Lohman Econometrics
Total Returns – Gold, Nasdaq and MSCI World ex-US With the Nasdaq at all-time high, markets expect a weak global growth, low inflation and a strong U.S. dollar. Image: Gavekal, Macrobond
Nasdaq 100 vs. S&P 500 Ratio The ratio of the Nasdaq 100 to the S&P 500 has only been higher in 2000, during the dotcom bubble. Image: Bespoke Investment Group
U.S. Election – Nasdaq vs. Probability of Democratic Presidential Win in 2020 Has the market already priced in a democratic victory in November? Image: Variant Perception Research
Bubble – Nasdaq Composite Index and Federal Funds Target Rate If the Fed allows an asset price bubble, the consequences are severe and long-lasting when it burst. Image: Bloomberg
Performance for the Year: S&P 500, Nasdaq Composite and Dow Jones Industrial Average U.S. stocks climbed, erasing 2020 losses, as easing lockdowns boosts risk appetite. Image: Financial Times