S&P 500 Four-Year Cycle for 2026
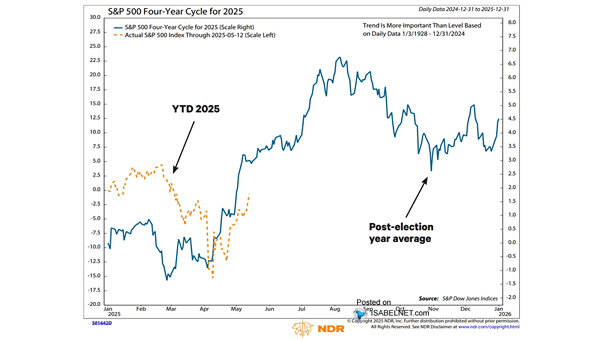
S&P 500 Four-Year Cycle for 2026 The recent choppy trade fits the script of the four-year presidential cycle’s midterm-year rhythm. From March to April, the S&P 500 often rallies toward its yearly peak before sentiment…