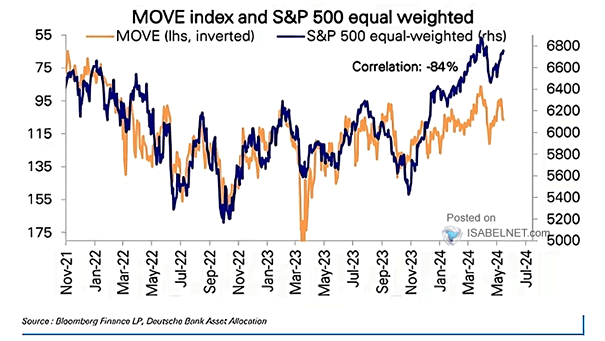
MOVE Index vs. U.S. 10-Year Note
MOVE Index vs. U.S. 10-Year Note Unlike in 2022, U.S. 10-year yields are higher year to date, but rate volatility has stayed contained. Implied and realized volatility remain compressed even as inflation risks and Fed…