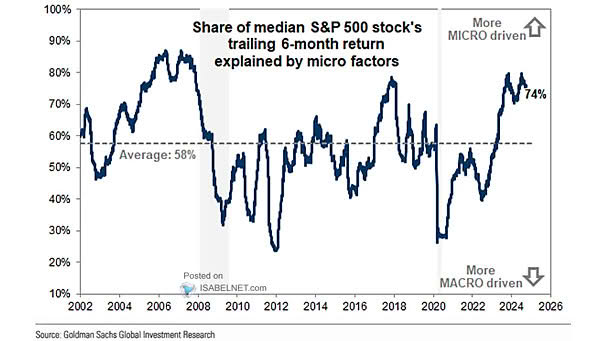
U.S. Core CPI Inflation
U.S. Core CPI Inflation In September, U.S. core CPI inflation showed a modest increase of 0.312% month-over-month, indicating that inflation pressures are not significantly escalating. Image: Nomura
China GDP Growth Consensus Estimates GDP upgrades are likely to spur interest in China’s markets, encouraging asset allocation towards sectors that align with the country’s economic transformation. Image: BofA Global Investment Strategy
Performance – U.S. Small Cap Stocks vs. Large Cap Stocks Small caps continue to face significant challenges relative to large caps, a trend that has persisted for several years. However, there is a growing sense…
VIX Index and S&P 500 Realized Volatility The spread between the VIX and the S&P 10-day realized volatility, when in the 98th percentile, may signal a potential opportunity for U.S. stocks to rally towards the…
U.S. Nonfarm Payrolls vs. U.S. ISM Manufacturing PMI The U.S. ISM manufacturing index reading below 50 signals a contraction in manufacturing activity, which may impact payroll numbers. However, the relationship between the index and actual…
MSCI World Fwd PE and EPS Revisions Downward revisions in global EPS raise concerns, suggesting that the global economic landscape is precarious, prompting central banks to adopt more aggressive strategies to stimulate growth. Image: J.P.…
GWIM Debt Holdings as % of AUM Bank of America’s private clients maintain a low debt allocation of 20%, which remains significantly below the average level. Image: BofA Global Investment Strategy
S&P 500 Returns When New Highs Are Made In October Bulls smile when new highs are made in October, as the fourth quarter has historically seen gains 90% of the time, averaging a 5% return…
S&P 500 Historical FY2 EPS Revisions vs. Consensus EPS Recent downward revisions in S&P 500 EPS estimates for 2024-25 reflect a cautious approach from analysts, primarily driven by economic uncertainties. Image: BofA US Equity &…
Spread Between BBB-Rated Corporate Bond Yield and 90-Day U.S. Treasury Bill Yield The recent increase in the spread between IG credit yield and cash yield marks a significant shift from a 43-year low. Should investors…
GWIM Cash Allocation as % Asset Under Management BofA’s private clients have reduced their cash allocation, remaining below the long-term average, while increasing their equity exposure. Image: BofA Global Investment Strategy