Probability of S&P 500 Drawdown / Rally
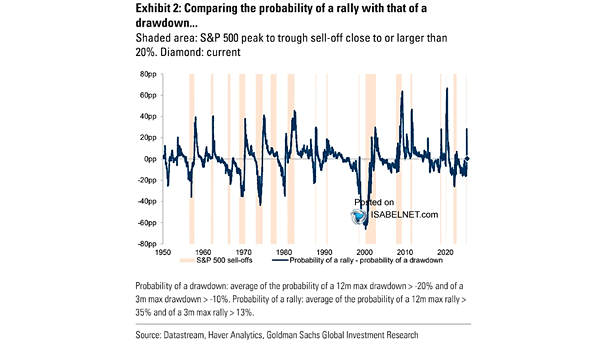
Probability of S&P 500 Drawdown / Rally In the days following “Liberation Day,” the odds of a sharp rally were high. Now, the balance has flipped: drawdown risk feels heavier, and equity asymmetry reflects a…
Probability of S&P 500 Drawdown / Rally In the days following “Liberation Day,” the odds of a sharp rally were high. Now, the balance has flipped: drawdown risk feels heavier, and equity asymmetry reflects a…
Estimated Exposure to AI Automation Investors are punishing U.S. sectors most exposed to AI‑driven automation, betting that vulnerable business models will struggle to keep pace, despite steady fundamentals. Automation’s shockwaves are reshaping entire sectors. Image:…

Hyperscaler Quarterly Capex Growth Later in 2026, hyperscalers are expected to ease capex growth, a shift that could drag on valuations but also leave them vulnerable in the supply-strained fight for AI dominance. Image: Goldman…
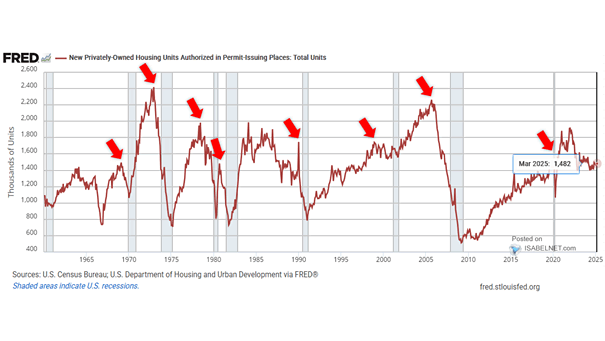
U.S. New Private Housing Units Authorized by Building Permits and Recessions In December, U.S. building permits rose to 1.448 million. Historically, building permits tend to peak and then decline prior to economic recessions. Image: Federal…
Congressional Budget Office Forecast of 10-Year U.S. Treasury Yield The Congressional Budget Office sees the 10-year U.S. Treasury yield edging higher over the next few years as swelling federal debt puts upward pressure on borrowing…
S&P 500 Four Month Range The S&P 500 has spent four months drifting in a tight range, the kind of calm that rarely lasts. Which way it breaks is anyone’s guess, but as traders like…
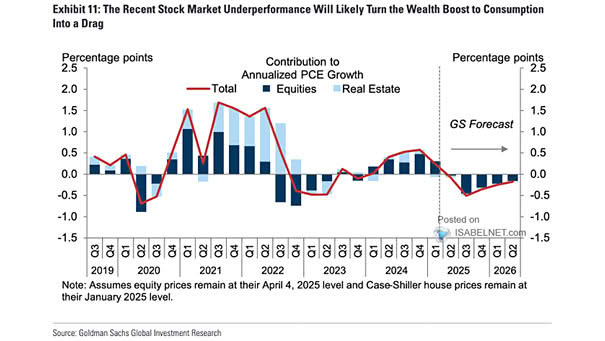
Estimated Wealth Effects on Annualized Real PCE Growth Should stocks stumble, the positive wealth effect supporting consumption may turn into a headwind during the second half of 2026. After all, consumer sentiment is definitely tied…
Share of Russell 3000 Firms Discussing Layoffs During Quarterly Earnings Calls You won’t hear much about layoffs on earnings calls these days, a hint that management still sees blue skies for growth. Talk of job…
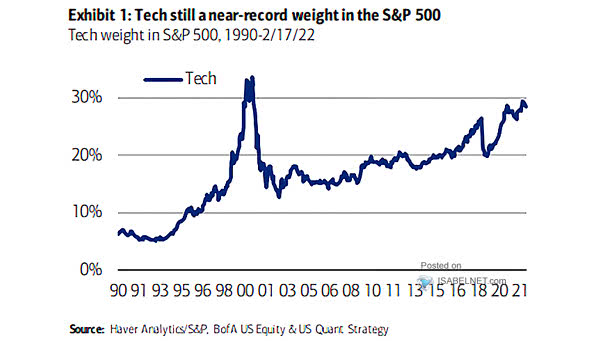
Weight of TMT in the S&P 500 At 37% of S&P 500 earnings, Information Technology and Communication Services remain the market’s driving force, with the trend still pointing higher. Hard to bet against tech when…
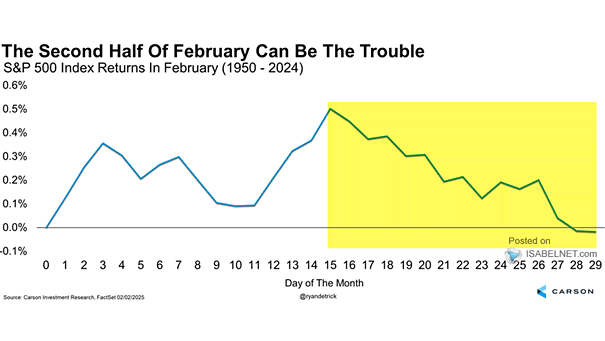
S&P 500 Index Returns in February The S&P 500 tends to lose a bit of steam as February winds down, with the final days often trending softer. Nobody likes it, but few are really surprised. Image:…
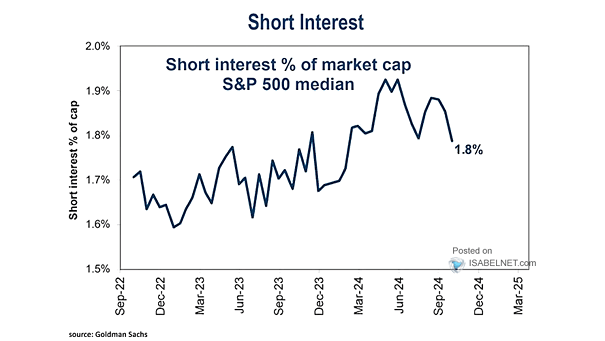
Short Interest as % of Market Capitalization S&P 500 Median At 2.7%, short interest for the median S&P 500 stock is on the high side, but the buildup appears tied to portfolio hedging, not a…