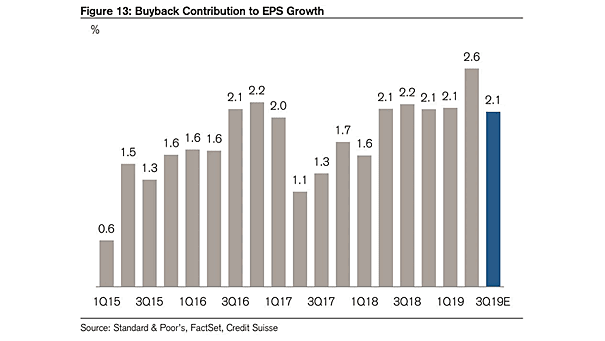
Contribution to EPS Growth
Contribution to S&P 500 EPS Growth The seven biggest S&P 500 stocks are set to drive 46% of the index’s EPS growth in 2026, down slightly from a 50% share this year as the rest…
Contribution to S&P 500 EPS Growth The seven biggest S&P 500 stocks are set to drive 46% of the index’s EPS growth in 2026, down slightly from a 50% share this year as the rest…
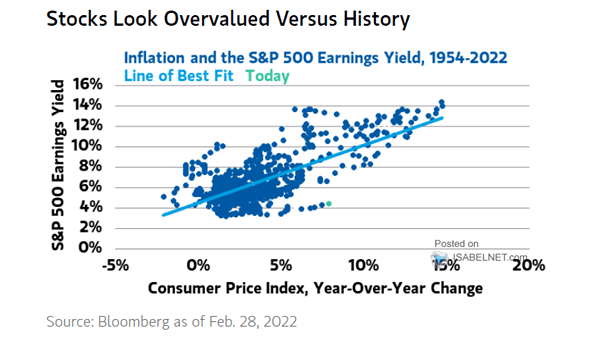
S&P 500 Earnings Yield Based on Shiller Cyclically-Adjusted P/E The S&P 500’s earnings yield, based on Shiller’s cyclically adjusted P/E, sits near century lows. But if history is any guide, valuations can defy gravity for…
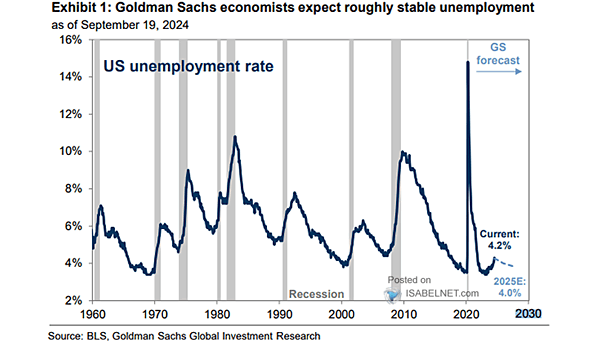
U.S. Unemployment Rate and U.S. Heavy Trucks Sales (Leading Indicator) Sales of U.S. heavy trucks tend to lead the economic cycle. When they drop, unemployment usually starts rising about six months later. Image: Goldman Sachs…
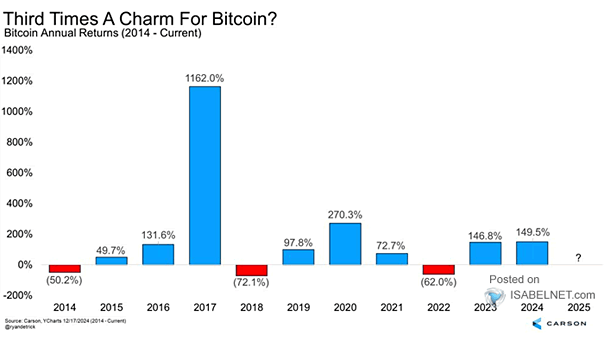
Bitcoin Annual Returns Bitcoin is sliding toward a year of losses, and this one comes without the usual chaos. No fraud, no implosion, just a quieter, more mature market learning that pain isn’t always tied…

S&P 500 Index Performance in Year +1 After Three Consecutive >=+20% Gains While some volatility is likely, momentum still favors the bulls. After a powerful run from 2023 to 2025, the S&P 500 Index could…
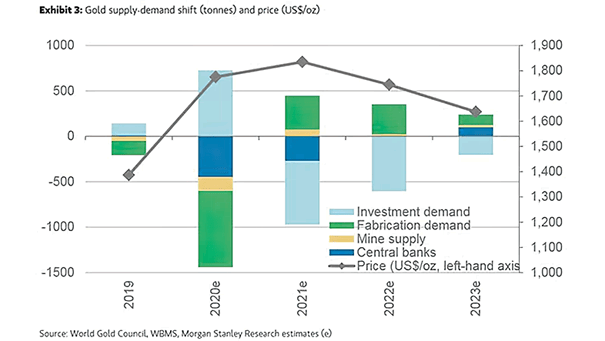
Gold Price (5-Year Rolling Change) and World Military Expenses When governments ramp up military spending, gold tends to sparkle. Rising geopolitical risks and looser fiscal policy weaken paper currencies and revive inflation worries, sending investors…
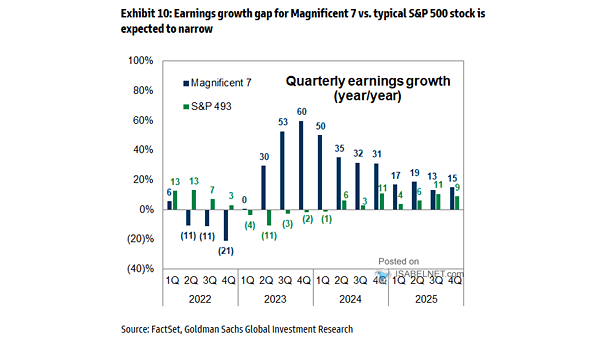
Earnings Growth The gap between the Magnificent Seven and the rest of the S&P 500 is expected to narrow, paving the way for a broader, more balanced earnings landscape across the index in 2026 and…
U.S. Current Account Balance as a % of GDP The U.S. current account deficit has been on a widening path since 2019 and looks poised to stay elevated into 2026. Image: Gavekal, Macrobond
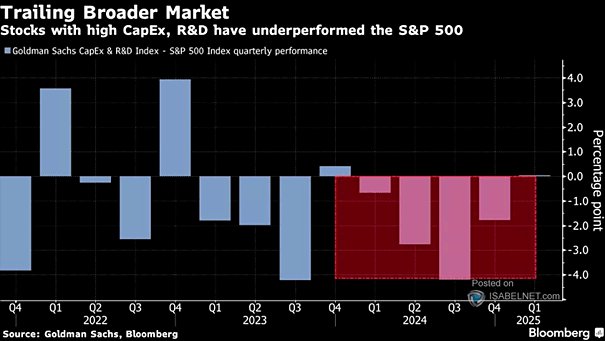
Hyperscaler Capex Hyperscalers are on pace to spend $4 trillion on capex by 2030, more than ten times what the Apollo program cost in today’s dollars, a bet that leaves little room for error. Image:…
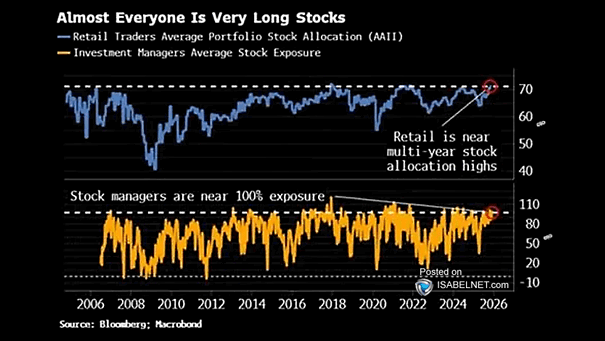
Retail Traders Average Portfolio Stock Allocation and Investment Managers Average Stock Exposure Over the past two decades, periods when both retail and professional traders were this heavily long have often been followed by S&P 500…
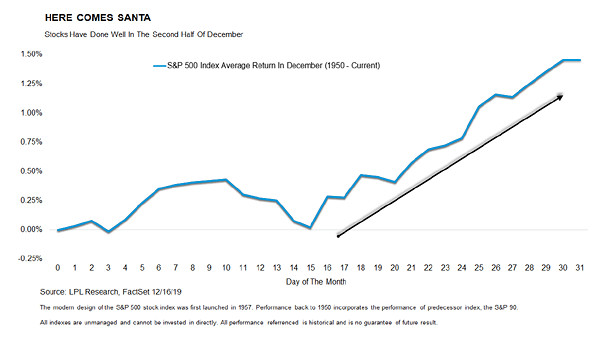
S&P 500 Average Return in December With the holidays in sight, buyers are starting to reappear. History shows U.S. stocks often find a floor around mid-December and rally into year-end, a seasonal lift the bulls…