Performance for Gold
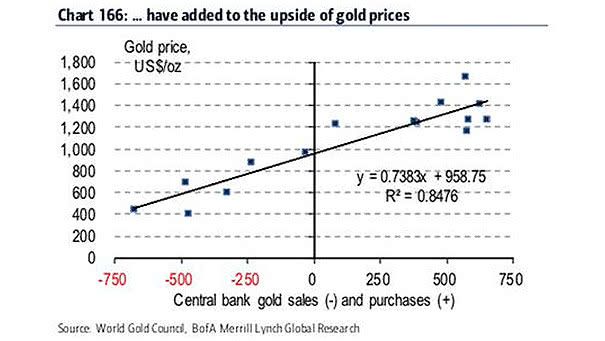
Performance for Gold Gold often starts the year strong, with January usually one of its best months as post-holiday portfolio adjustments and fresh investment flows boost demand. Image: Deutsche Bank
Performance for Gold Gold often starts the year strong, with January usually one of its best months as post-holiday portfolio adjustments and fresh investment flows boost demand. Image: Deutsche Bank
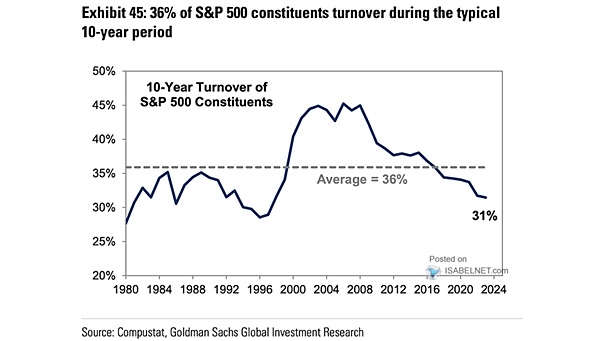
5-Year Turnover of S&P 500 Constituents In a typical five-year stretch, about 20% of S&P 500 members turn over, a reminder of how tough it is to stay in the game for the long haul.…
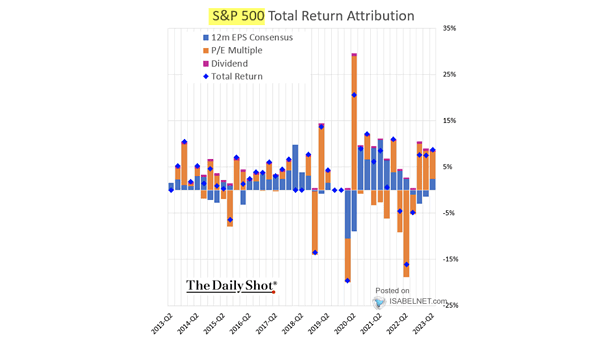
Components of S&P 500 Total Return Corporate profits carried much of the load for the S&P 500 in 2025, powering most of the index’s gains. In 2026, earnings look set to stay behind the wheel,…
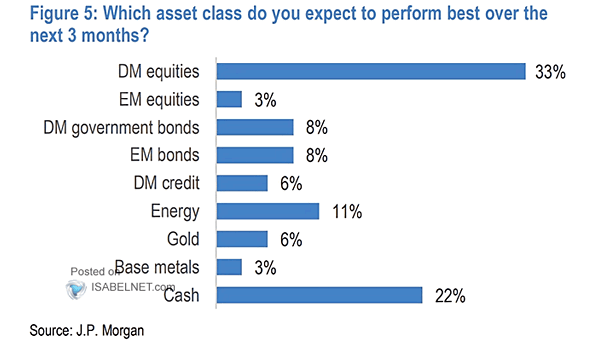
S&P 500 – Which Will Perform Best in 2026? More portfolio managers see the “S&P 493” gaining ground on the Magnificent 7 this year, with fundamentals improving and valuation spreads closing amid worries over index…
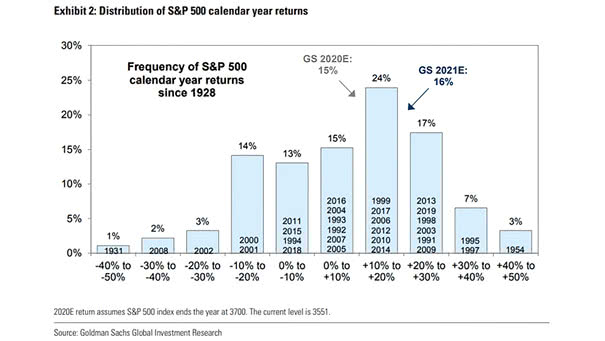
Distribution of 1-Year S&P 500 Returns in Non-Recession Years Double‑digit losses are a rarity outside recessions, just 5% of the time. But when growth kicks in, the S&P 500 usually surges, notching double-digit gains nearly…
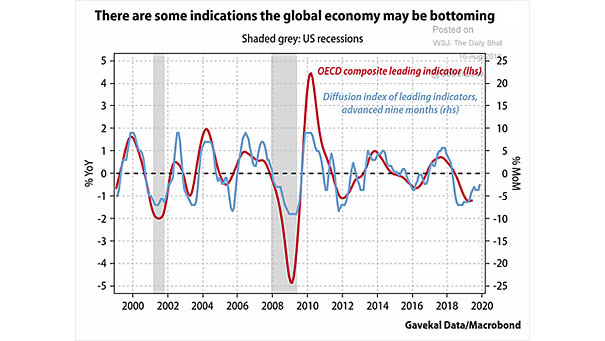
OECD G20 Composite Leading Indicator The OECD’s global leading indicator is running above trend and gaining momentum, signaling a pickup in the global growth cycle that has historically coincided with stronger risk-asset performance over government…

S&P 500 Annual Performance Based On What The First Five Days Do A bullish start to the year for the S&P 500 lifts investor spirits. When the index is up more than 1% in the…
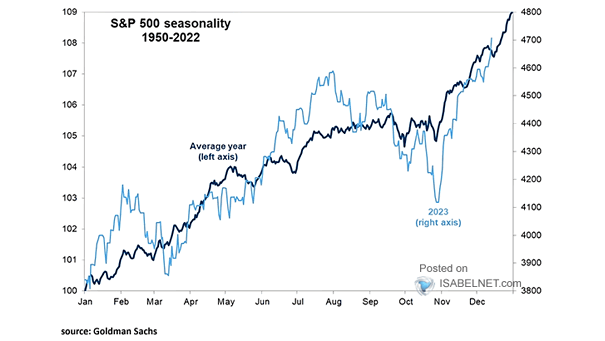
S&P 500 Seasonality While seasonality in the S&P 500 always tells a story, midterm years rank as the weakest in the four-year presidential cycle but still deliver positive returns more often than not. Image: Goldman…
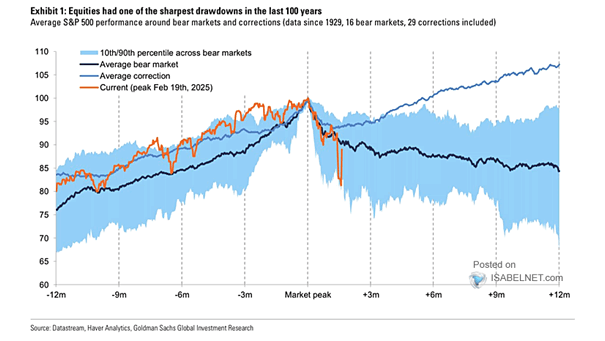
Average S&P 500 Performance Around Bear Markets and Corrections U.S. stocks have a history of pushing higher toward bull market peaks before eventually pulling back. In such periods, corrections tend to be brief, with rebounds…
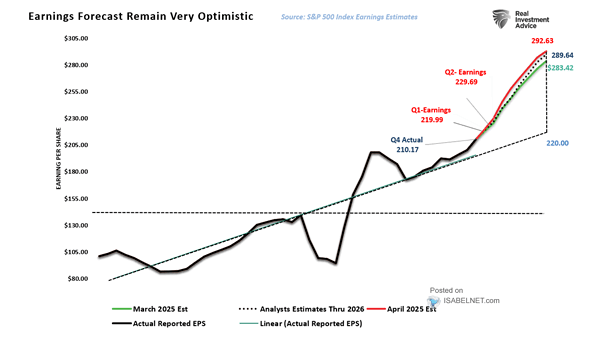
S&P 500 Earnings and Estimates Optimism for 2026 earnings remains high after years of market gains and profit growth, but history shows confidence tends to waver once forecasts meet reality. Image: Real Investment Advice
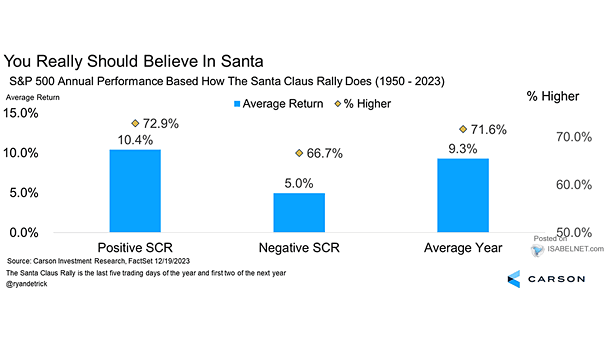
S&P 500 Annual Performance Based How the Santa Claus Rally Does A missing Santa Claus rally is rarely good news. Since 1950, years that skipped the festive lift have averaged only 6.1% gains. For bulls,…