Share of Global Annual CO2 Emissions
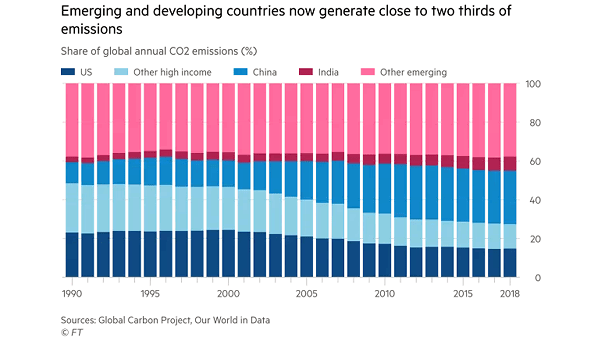
Share of Global Annual CO2 Emissions To achieve the global warming target in the Paris Agreement, net zero emissions should be reached by 2050. Image: Financial Times
Share of Global Annual CO2 Emissions To achieve the global warming target in the Paris Agreement, net zero emissions should be reached by 2050. Image: Financial Times
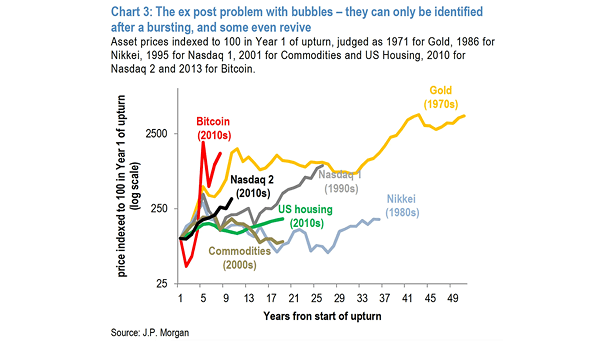
Bubbles – Bitcoin, Nasdaq, Gold, U.S. Housing, Commodities, Nikkei Detecting and measuring asset bubbles is not an easy task. This chart puts things into perspective. Image: J.P. Morgan
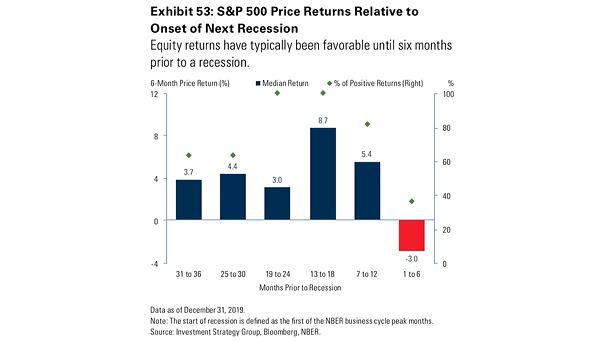
S&P 500 Price Returns Relative to Onset of Next U.S. Recession The performance of the S&P 500 has generally been positive until six months prior to a recession. Image: Investment Strategy Group, Bloomberg
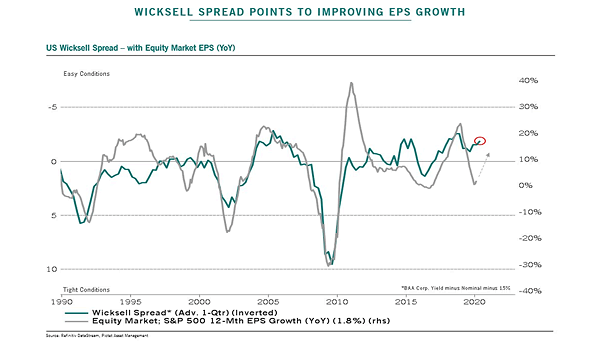
Wicksell Spread and S&P 500 12-Month EPS Growth (Leading Indicator) This chart suggests that the Wicksell spread tends to lead the S&P 500 12-Month EPS growth by 3 months. Image: Pictet Asset Management
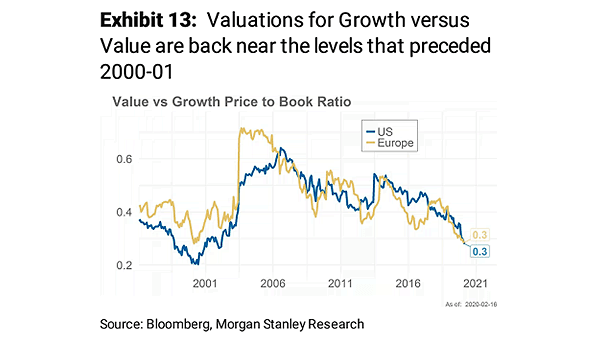
U.S. and Europe: Value vs. Growth Price to Book Ratio Valuations for growth vs. value are back near the levels that preceded 2000-01, but the trend is still intact for the time being. Image: Morgan…
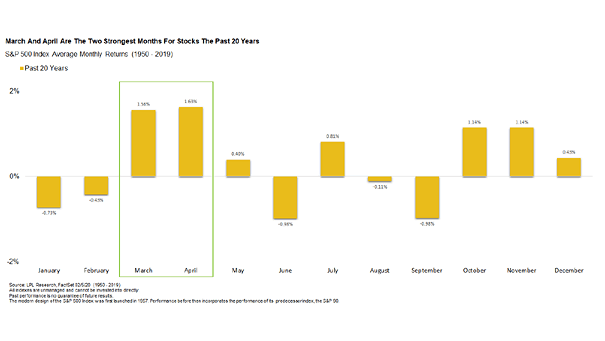
S&P 500 Index Average Monthly Returns Over the past 20 years, March and April have been the two strongest months. Image: LPL Research
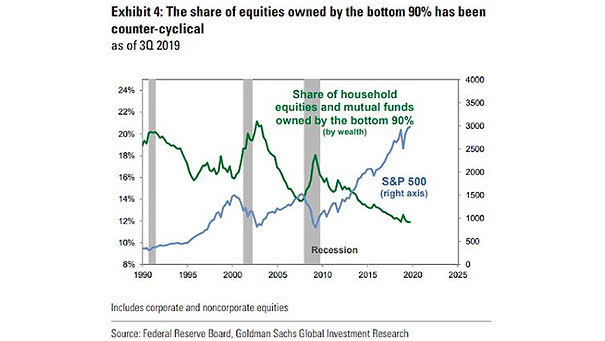
Share of Household Equities and Mutual Funds Owned by the Bottom 90% Chart showing that share of household equities and mutual funds owned by the bottom 90% has been counter-cyclical. Image: Goldman Sachs Global Investment…
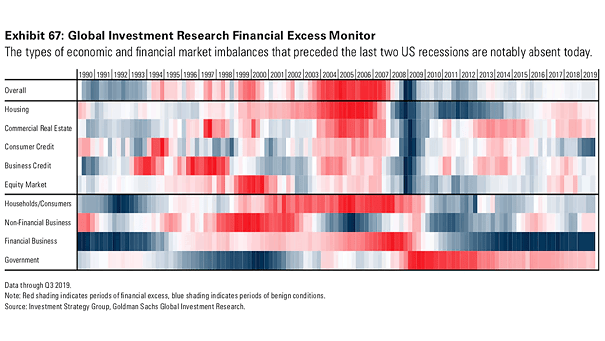
Global Investment Research Financial Excess Monitor and Recessions The heat map suggests below-average imbalances in the U.S. economy. Image: Goldman Sachs Global Investment Research
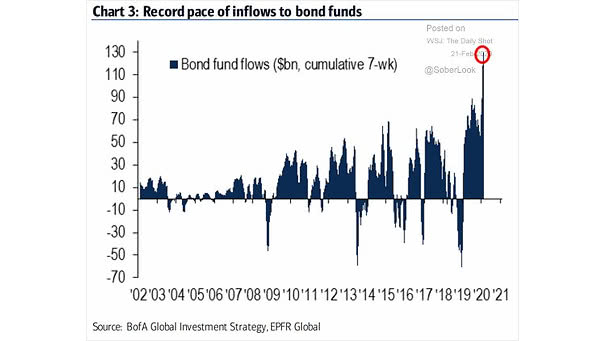
Bond Fund Flows Bond funds hit inflow record, reflecting investor fears about the coronavirus’s spread. Image: BofA Global Investment Strategy
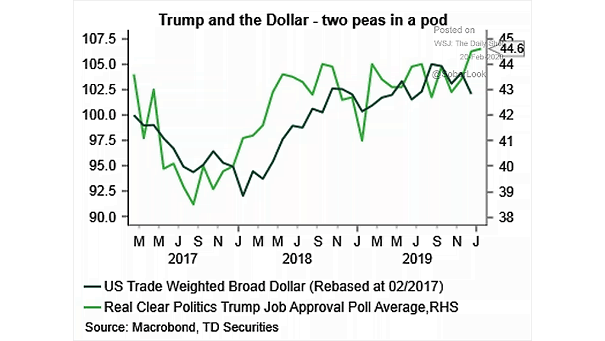
U.S. Dollar and President Trump This chart shows the correlation between the U.S. dollar and President Trump’s approval ratings Image: TD securities
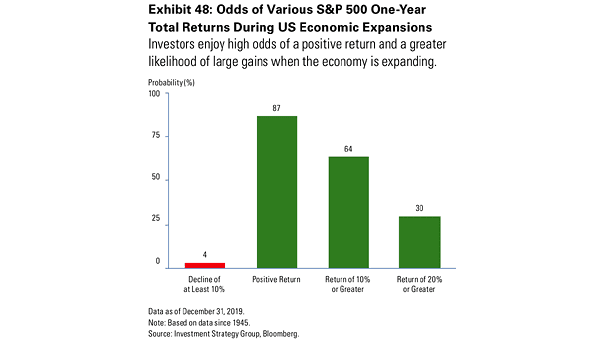
Odds of Various S&P 500 One-Year Total Returns During U.S. Economic Expansions This chart suggests the probability of positive one-year market returns when the U.S. economy is expanding. Image: Investment Strategy Group, Bloomberg