Gold vs. U.S. M2 and U.S. Debt to GDP
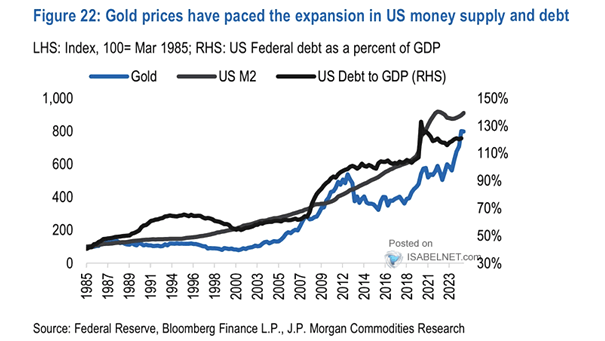
Gold vs. U.S. M2 and U.S. Debt to GDP Historically, gold prices have tracked the expansion of the money supply and have responded to increases in U.S. government debt. Image: J.P. Morgan Commodities Research
Gold vs. U.S. M2 and U.S. Debt to GDP Historically, gold prices have tracked the expansion of the money supply and have responded to increases in U.S. government debt. Image: J.P. Morgan Commodities Research

ISABELNET Cartoon of the Day Bulls are confident that the bull market in 2025 is as secure as a dog with a bone—stay ready for surprises! Have a Great Day, Everyone! 😎
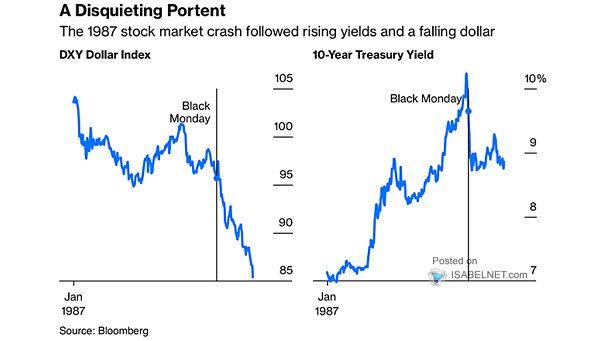
1987 Market Crash – DXY Dollar Index and 10-Year UST Yield Bond yields rarely rise while the dollar falls, as higher yields usually boost currency appeal. This unusual trend signals waning confidence, similar to the…
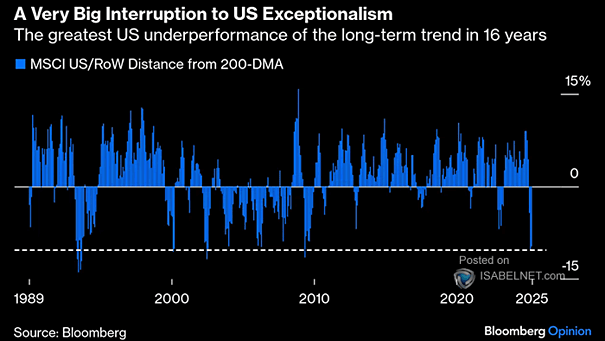
Equities – MSCI U.S./RoW Distance from 200-DMA The MSCI U.S./RoW distance from the 200-DMA highlights a major interruption to the narrative of U.S. exceptionalism and reinforces the need for global diversification in equity portfolios. Image:…
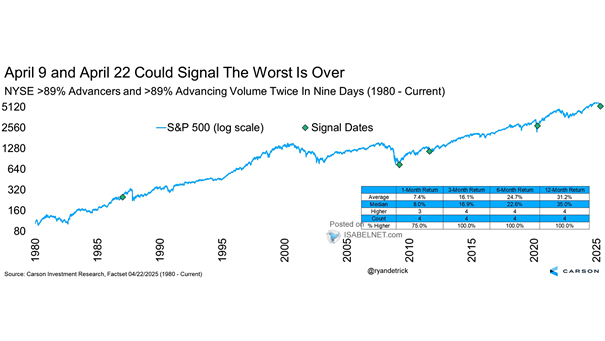
S&P 500 and NYSE >89% Advancers and >89% Advancing Volume in Nine Days A rare event—over 89% of NYSE stocks and volume advancing twice in nine days—has historically signaled strong bullish momentum. Since 1980, the…

ISABELNET Cartoon of the Day Wall Street bears are convinced the bull market is crazy, but bulls are too busy wearing noise-canceling headphones to hear any warnings. Happy “Hump” Day, Everyone! 🐫🐪😎
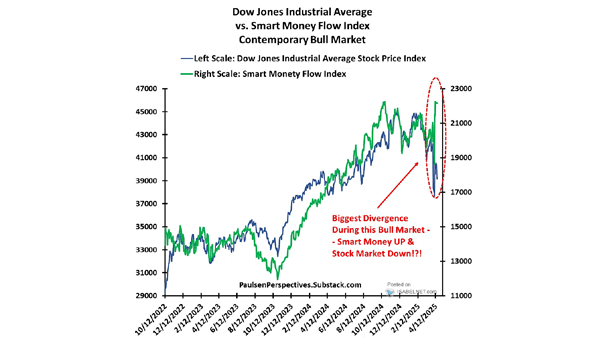
Dow Jones Industrial Average vs. Smart Money Flow Index The Smart Money Flow Index currently suggests that the most probable short-term direction for the U.S. stock market is upward. Image: Paulsen Perspectives

ISABELNET Cartoon of the Day When bulls sense a market boom, bears are quick to dismiss it, claiming there’s “nothing to see here.” Have a Great Day, Everyone! 😎
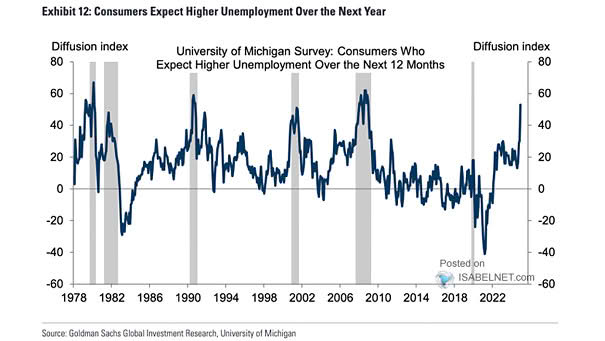
University of Michigan Survey – Consumer Who Expect Higher Unemployment over the Next 12 Months The latest University of Michigan Surveys of Consumers indicate that a significantly higher share of Americans now expect unemployment to…
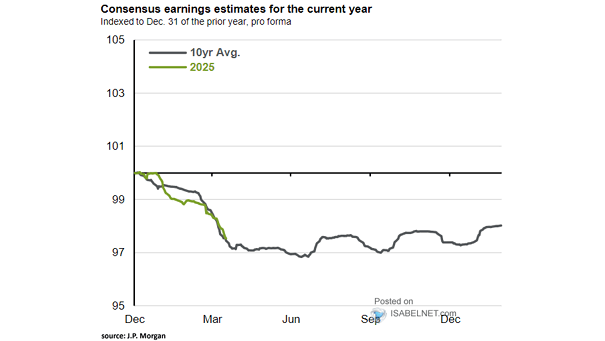
Consensus Earnings Estimates Despite economic uncertainties and potential tariff impacts, downward revisions to 2025 EPS estimates have remained modest, underscoring their resilience. Image: J.P. Morgan Asset Management
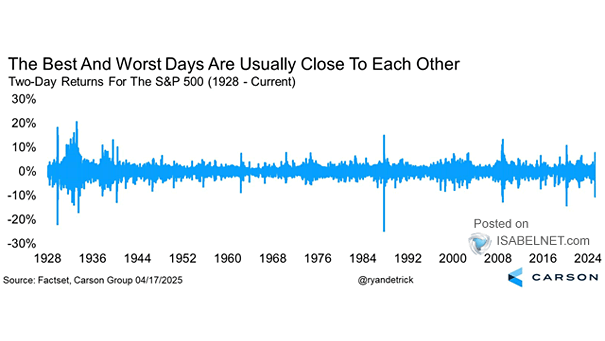
Two-Day Returns for the S&P 500 The clustering of best and worst days underscores the importance of patience and discipline in investing. Selling after the worst days often means missing the best days that follow!…