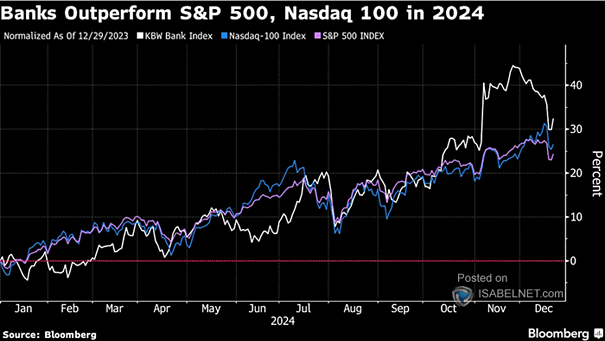
S&P 500
S&P 500 vs. 20+-Year U.S. Treasuries U.S. stocks continue to outperform bonds in an ongoing post-pandemic risk-on rally, despite periods of volatility. Market sentiment remains tilted toward risk assets. Image: Bloomberg
S&P 500 vs. 20+-Year U.S. Treasuries U.S. stocks continue to outperform bonds in an ongoing post-pandemic risk-on rally, despite periods of volatility. Market sentiment remains tilted toward risk assets. Image: Bloomberg
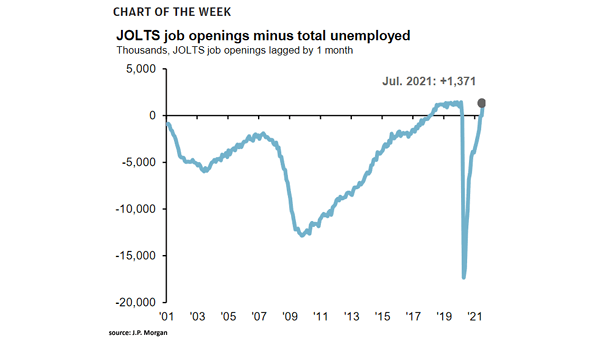
U.S. Labor Market – Job Openings per Unemployed Worker The ratio of U.S. job openings to unemployed workers below 1 indicates labor market weakness, with policy uncertainty and slowing demand increasing the likelihood of a…
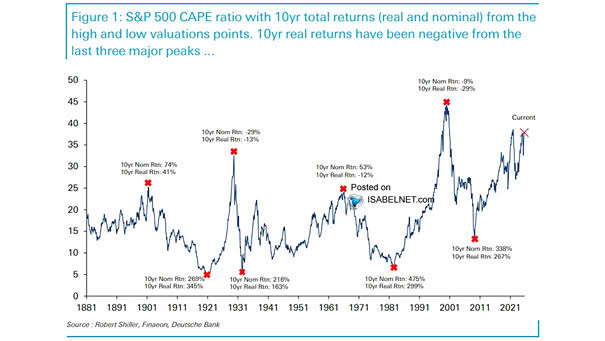
Valuation – S&P 500 CAPE Ratio with 10-Year Total Returns Valuations don’t matter—until they do. Over the past 150 years, high valuations have been a sign of poor forward returns, with negative real returns over…
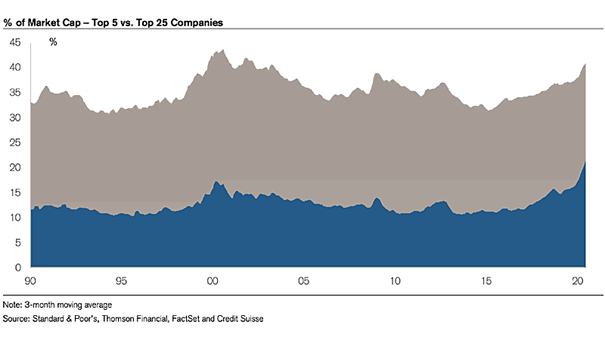
Share of Top 5 Companies by Market Capitalization in the S&P 500 The U.S. equity market is highly concentrated in just a few mega-cap tech companies. While this does not definitively mean the U.S. is…
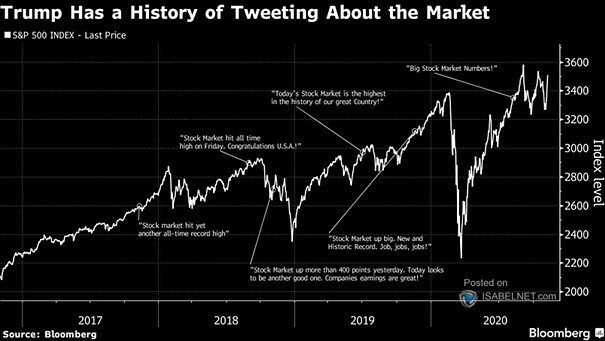
President Trump Tweets Contribute to Market Volatility President Trump’s tweets during his first term had a significant impact on financial markets, often contributing to increased volatility. During Trump’s second term, the dynamics appear similar. Image:…
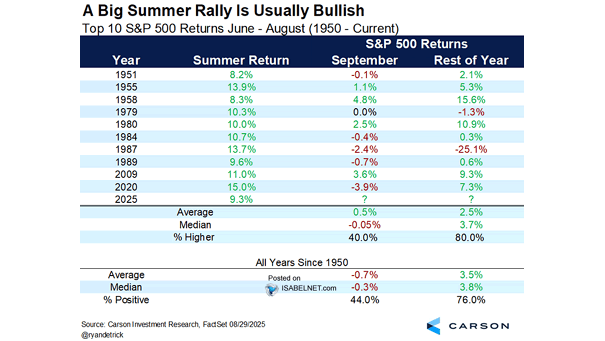
Top 10 S&P 500 Returns June – August A strong summer rally, such as the one in 2025, typically signals bullish sentiment and often leads to further gains in the S&P 500 for the remainder…
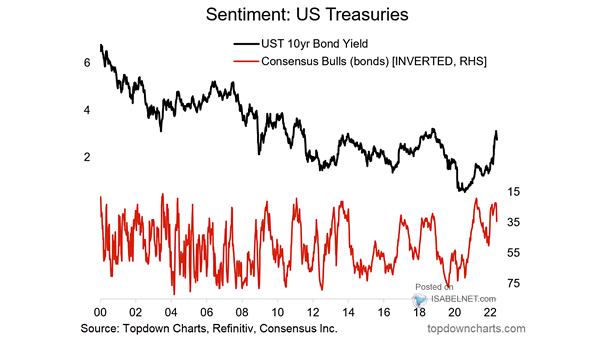
Average and Median Monthly 10-Year U.S. Treasury Yield Change Since 2000 U.S. Treasury bond yields typically increase in September and October due to a surge in bond supply after the summer lull, combined with market…
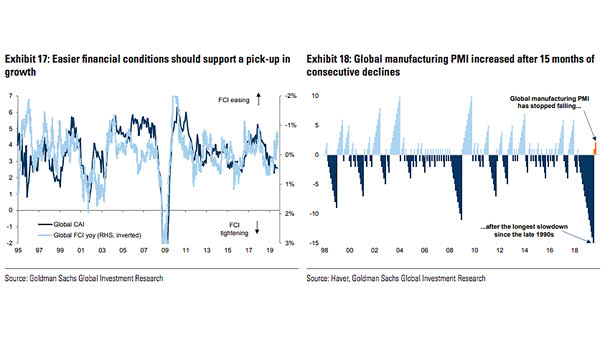
Global Financial Conditions Index Global financial conditions have eased to a 12-month low, supported by expectations of monetary policy easing, improved investor sentiment, tightening credit spreads, and a more stable economic outlook. Image: Goldman Sachs…
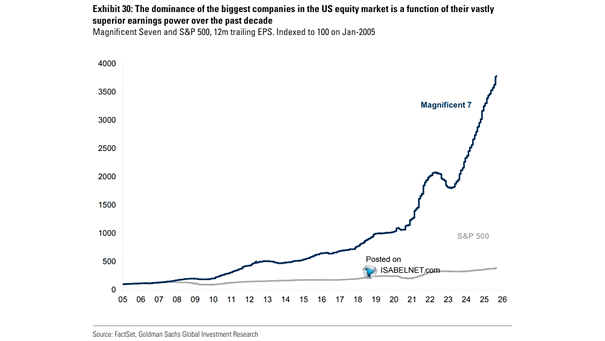
Magnificent Seven and S&P 500 – 12-Month Trailing EPS The strong earnings power and consistent profit growth of the largest U.S. companies have been key factors in maintaining their dominant positions in the U.S. equity…
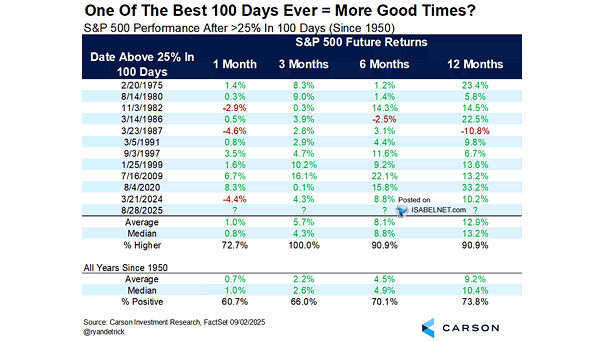
S&P 500 Performance After >25% Rally in 100 Trading Days (Since 1950) Good news for bulls: since April’s low, the S&P 500 has risen over 25% in 100 trading days—a rare event. Historically since 1950,…
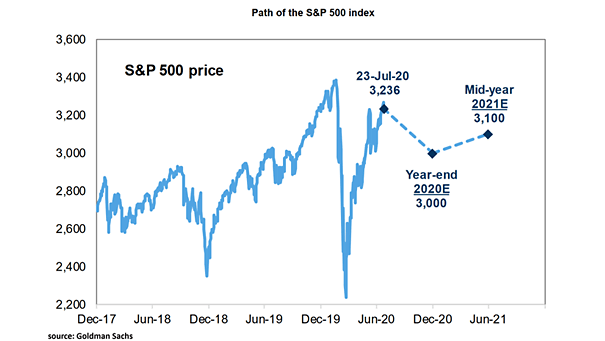
S&P 500 2026 Target Driven by enthusiasm for artificial intelligence, Evercore ISI forecasts the S&P 500 will rise to 7,750 points by the end of 2026, marking a 20% gain from current levels. Image: Bloomberg