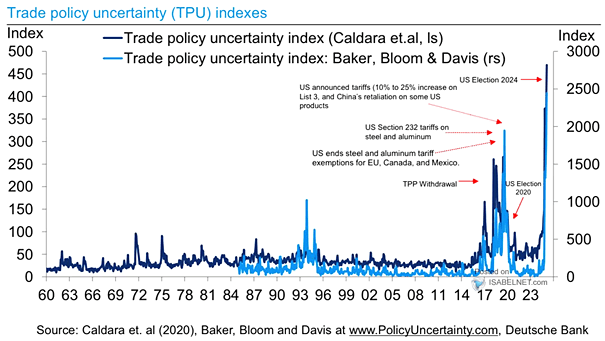
Trade Policy Uncertainty Indexes
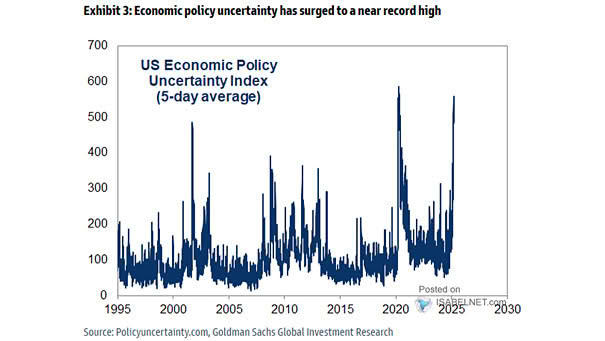
Trade Policy Uncertainty Indexes Uncertainty in trade policy often leads to positive future returns for the S&P 500, as markets tend to price in worst-case scenarios during unclear times. Once clarity emerges, stocks frequently recover.…