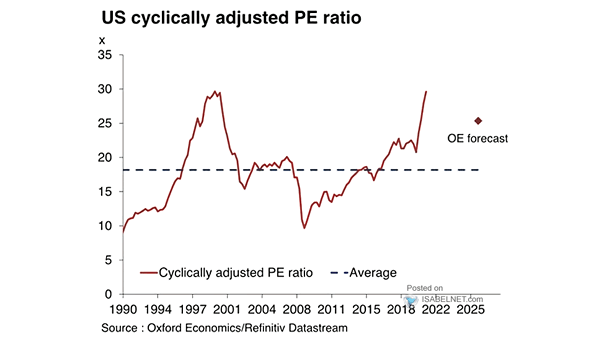
Valuation – S&P 500 Shiller Cyclically-Adjusted P/E Ratio vs. Model-Predicted P/E Ratio
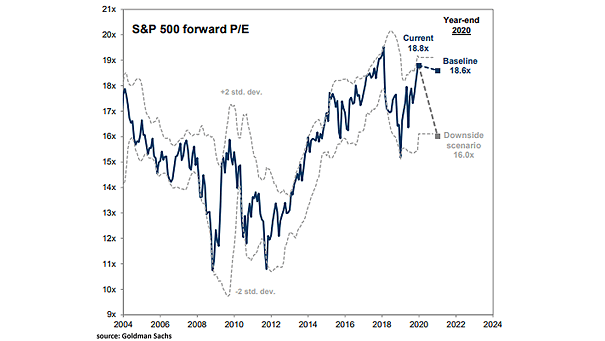
Valuation – S&P 500 Shiller Cyclically-Adjusted P/E Ratio vs. Model-Predicted P/E Ratio U.S. equities look expensive relative to both their own history and what today’s macro backdrop would normally justify. In past cycles, such stretches of pricey valuations have often been followed by years of subpar returns. Image: Goldman Sachs Global Investment Research