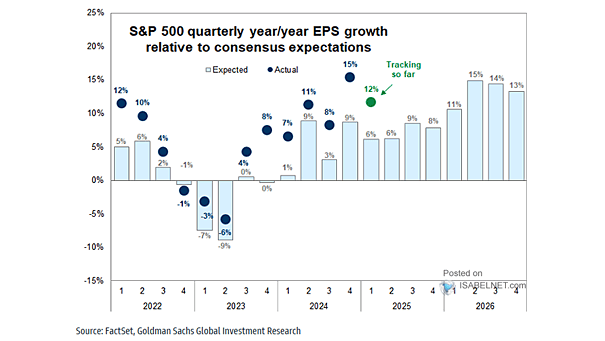
S&P 500 Forward Earnings Estimates
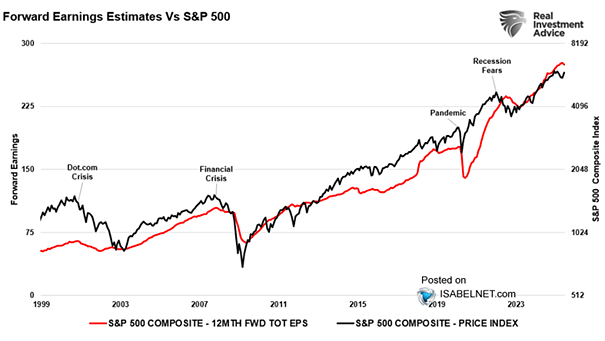
S&P 500 Forward Earnings Estimates Improving earnings fundamentals in the S&P 500 are keeping investors cautiously optimistic, as faster growth fuels confidence in another year of equity gains. Image: Real Investment Advice