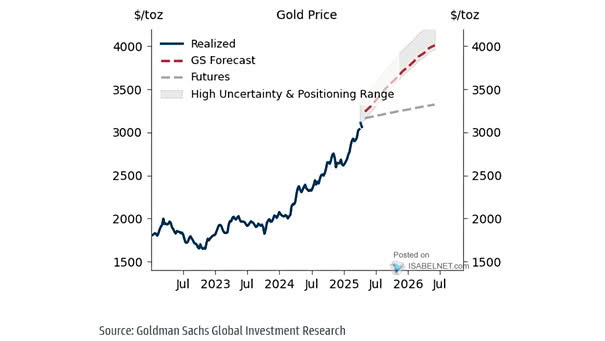
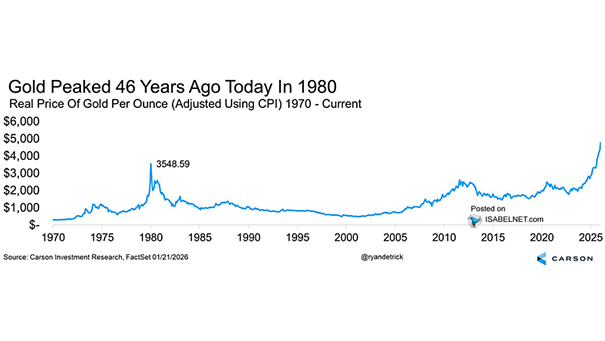
Sector Contribution to S&P 500 EPS Growth

Sector Contribution to S&P 500 EPS Growth Earnings for Q3 2025 are tracking close to the 8.5% S&P 500 EPS growth consensus, driven largely by the tech and financial heavyweights — a sign that this earnings season has real momentum. Image: J.P. Morgan Asset Management

Equity Allocation as % of Household Financial Assets

Equity Allocation as % of Household Financial Assets Equities dominate household portfolios in the U.S., Australia, and Sweden, but caution still rules in Europe and Japan, where cash and liquid assets remain king. Image: Goldman Sachs Global Investment Research

S&P 500 – Margin Debt Expansion vs. Contraction

S&P 500 – Margin Debt Expansion vs. Contraction Margin debt is soaring to levels that make some investors uneasy, flirting with the “danger zone.” For now, momentum still points higher—but a reversal would be the real red flag. Image: Topdown Charts

S&P 500 Index and Deviation from 40-Week Moving Average

S&P 500 Index and Deviation from 40-Week Moving Average The further the S&P 500 drifts from its 40-week moving average, the harder the reversion’s likely to be. It’s not a bear market call — just a reminder that momentum cuts both ways. Image: Real Investment Advice

S&P 500 Index – Seasonal 3-Month Forward Return

S&P 500 Index – Seasonal 3-Month Forward Return Historically, this is go-time for the S&P 500. If past trends hold, the next three months could deliver some of the index’s strongest cumulative gains. Image: Renaissance Macro Research

Buyback Aristocrats vs. Dividend Aristocrats

Buyback Aristocrats vs. Dividend Aristocrats Fueled by growth momentum and turbo‑charged buybacks, Buyback Aristocrats have left Dividend Aristocrats in the dust, as investors chase upside over income stability. Image: Goldman Sachs Global Investment Research

Total Holdings of U.S. Long-Term Securities

Monthly Foreign Net Purchases of Long-Term U.S. Securities Record foreign holdings of U.S. assets in 2025 point to lasting investor confidence, even in the face of global economic and geopolitical risks. Image: Bloomberg

Returns – Global Equities vs. Global Bonds vs. Gold vs. World Portfolio

Returns – Global Equities vs. Global Bonds vs. Gold vs. World Portfolio Since 1950, the world portfolio has earned a real 4.1% annual return — global equities led with 7.3%, gold lagged at 2.5%, and global bonds barely reached 1.8%. The long-run verdict is clear: equities have won. Image: Goldman Sachs Global Investment Research

Total Known Gold ETFs Holdings

Total Known Gold ETFs Holdings Gold’s shine isn’t fading. ETF holdings just hit a three‑year high, and even with this week’s selloff, gold prices are still up over 50% this year. Image: Bloomberg

Gold Price Forecast

Gold Price Forecast Bullish on bullion, Goldman Sachs sticks to its $4,900-an-ounce forecast for December 2026, betting that resurgent ETF demand and relentless central bank buying will keep the rally alive. Image: Goldman Sachs Global Investment Research