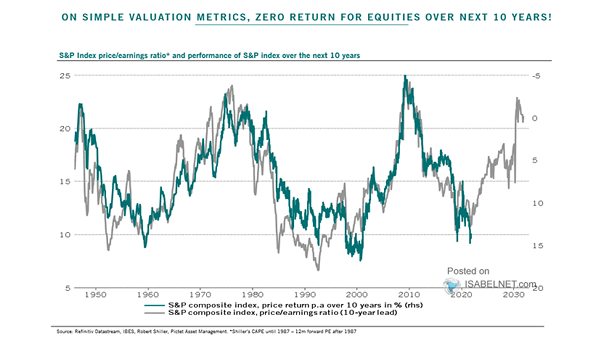
Equity Returns During Previous 10 Tightening Cycles
Equity Returns During Previous 10 Tightening Cycles Will the U.S. stock market keep investors smiling? Equity returns tend to be positive during tightening cycles. Image: TS Lombard
S&P 500 Index Monthly Performance in October In October, U.S. stocks tend to perform better in odd years than in even years, as odd years avoid elections and midterms. Image: LPL Research
U.S. Debts, Deficits and Economic Growth The rise in the U.S. deficit and debt has coincided with declining economic growth rates. Image: Real Investment Advice
Bonds and Correlations – 30-Year Treasury Yield The U.S. 30-year Treasury yield correlates with many intra-equity trends. Image: Alpine Macro
U.S. Excess Liquidity (M2 Minus Nominal GDP) and S&P 500 P/E Ratio (Leading Indicator) U.S. excess liquidity (M2 minus nominal GDP) tends to lead the S&P 500 P/E ratio by 6 months. Image: Nordea and Macrobond
Cumulative Share Buybacks by Sector U.S. companies have spent $11 trillion on share repurchases since 2004, which has helped drive the U.S. stock market to record levels. Image: Fidelity Investments
Number of S&P 500 Companies Citing Inflation on Earnings Calls S&P 500 company mentions of “inflation” jump to record levels. Image: Morgan Stanley Wealth Management
Equities as Share of Total Household Financial Assets U.S. households are loaded with equities. Will this end well? Image: BCA Research
China Excess Reserve Ratio and Credit Impulse (Leading Indicator) Investors should be pleased as Chinese stimulus is on the way. Image: BCA Research
Earnings Revisions Breadth and S&P 500 Price % Above/Below 200-Day Moving Average Earnings revisions have likely peaked. Image: Morgan Stanley Research
Rates – Short Duration vs. Long Duration Indexed Relative to Basket Return and 5-Year, 5-Year Forward Real U.S. Treasury Yield Short vs. long duration tends to track the path of U.S. rates. Image: Goldman Sachs Global Investment Research