
ISABELNET Cartoon of the Day
ISABELNET Cartoon of the Day Bears are wishing for gold this Christmas, chasing safety and inflation hedges, but bulls want just one thing under the tree: more stocks. Happy Holidays and Merry Christmas! 🎅🎄
ISABELNET Cartoon of the Day Bears are wishing for gold this Christmas, chasing safety and inflation hedges, but bulls want just one thing under the tree: more stocks. Happy Holidays and Merry Christmas! 🎅🎄
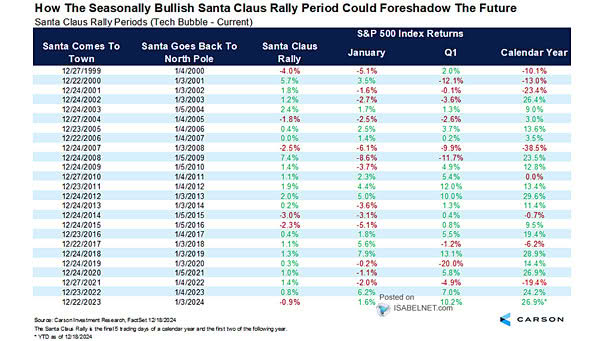
The Santa Claus Rally – S&P 500 Index Returns A festive Santa Claus rally has often paved the way for a strong January and solid year ahead, leaving investors feeling like kids on Christmas Day! Image: Carson Investment Research
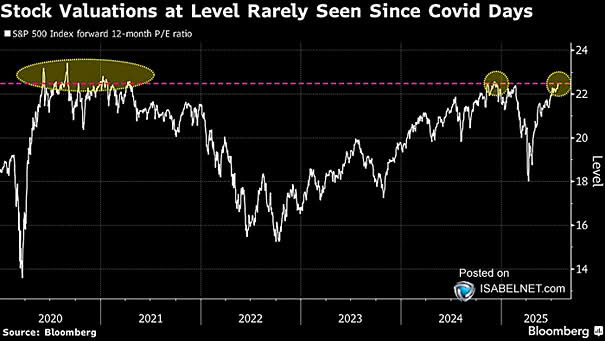
Valuation – S&P 500 Index Long-Term P/E Ratio The S&P 500’s long-term P/E ratio has surged to record highs, leaving investors with little buffer against bad news and making the market more vulnerable to economic or policy headwinds. Image: Bloomberg
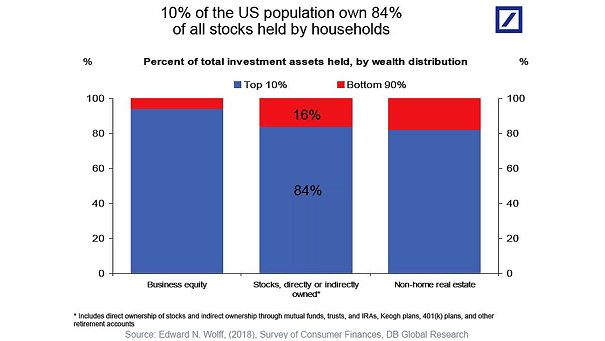
U.S. Household Wealth Stock market gains over the past six years have boosted U.S. household wealth and powered consumer spending, while also heightening vulnerability if markets fall. Image: Deutsche Bank
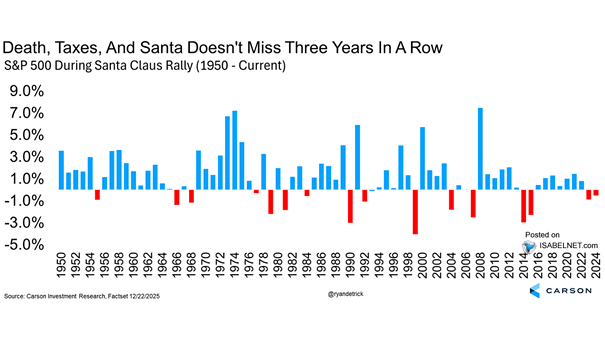
S&P 500 Returns During The Santa Claus Rally The Santa Claus Rally is the market’s year-end sweet spot, with U.S. stocks historically rising over the last five trading days of December and the first two of January. Since 1950, it has never posted losses three years in a row. Image: Carson Investment Research
2026 Equity Forecasts Goldman Sachs anticipates upside potential for global equities in 2026 amid a multipolar economic environment, while projecting modest underperformance for U.S. markets relative to international peers. Image: Goldman Sachs Global Investment Research
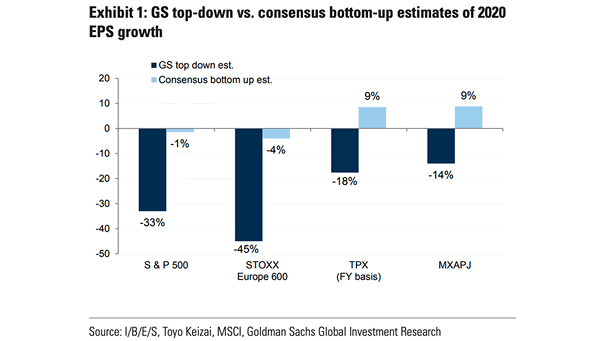
EPS – GS Top-Down vs. Consensus Bottom-Up Estimates Goldman Sachs sees S&P 500 EPS rising 12% in 2026 and 10% in 2027, driven by a resilient U.S. economy, a weaker dollar, strong mega-cap tech earnings, and AI-related productivity gains. Image: Goldman Sachs Global Investment Research
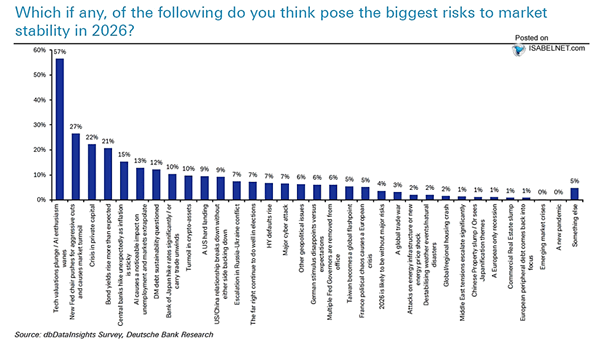
Survey – Biggest Risks to Market Stability in 2026 A rare consensus is emerging among investors on what could shake markets in 2026. Deutsche Bank’s latest survey finds AI and tech bubble jitters leading the pack, overshadowing concerns about Fed autonomy and private credit stress. Click the Image to Enlarge
U.S. Tech and S&P 500 – 1-Year Total Return Performance to Peak Past market bubbles often ended with explosive last-year rallies, far outpacing normal bull market returns. That kind of blow-off surge just isn’t happening in U.S. tech or the S&P 500 right now. Image: Goldman Sachs Global Investment Research
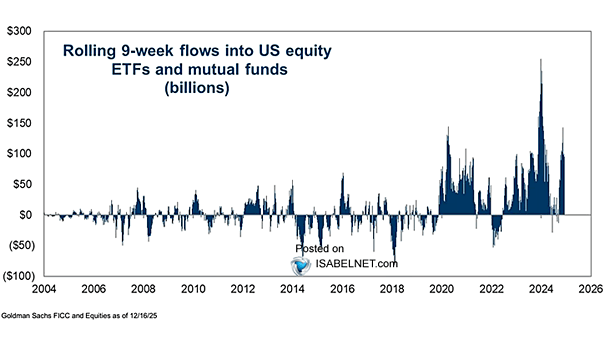
Rolling 9-Week Flows into U.S. Equity ETFs and Mutual Funds Investors keep buying the dip, pouring nearly $100 billion into U.S. equity mutual funds and ETFs over the past nine weeks, convinced the bull market still has room to run. Image: Goldman Sachs Global Investment Research
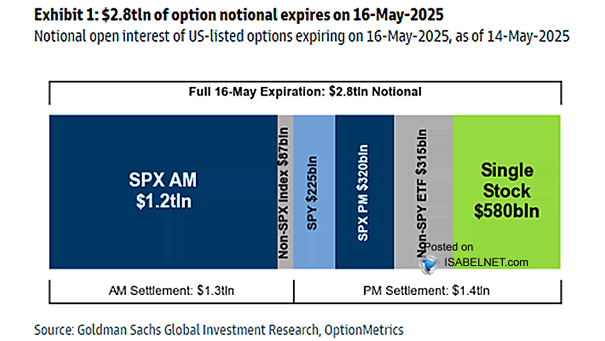
Volatility – U.S. Options Expiration $7.1 trillion in options notional value is set to expire today, marking the largest expiration on record and setting the stage for fresh market volatility. Image: Goldman Sachs Global Investment Research