Survey – Where Do You Expect 10-Year U.S. Treasury Yields to Be One Year from Now?
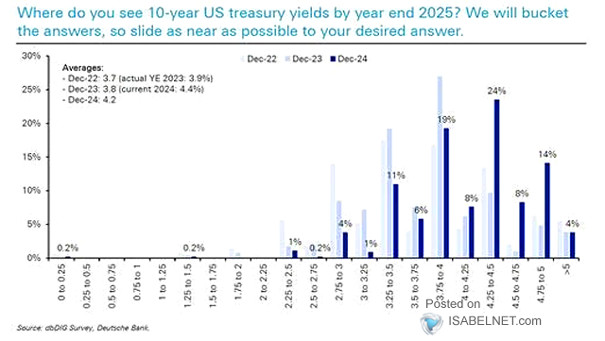
Survey – Where Do You Expect 10-Year U.S. Treasury Yields to Be One Year from Now? Deutsche Bank’s latest survey shows that 52% of participants expect the 10-year U.S. Treasury yield to rise above 4.25% next year, with the bank’s strategists calling for 4.45% by the end of 2026. Image: Deutsche Bank