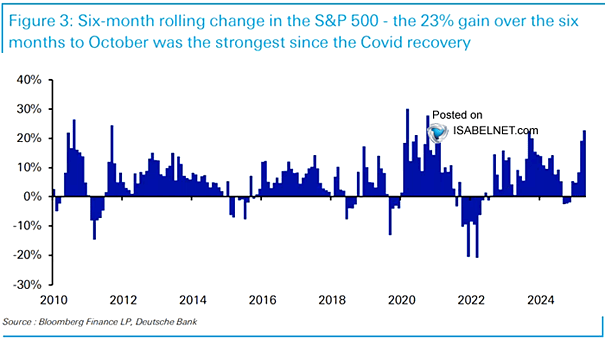
U.S. Federal Debt Held by the Public

U.S. Federal Debt Held by the Public The U.S. public debt has reached unprecedented levels both in absolute terms and relative to the economy, raising significant concerns about the country’s fiscal sustainability and economic future. Image: Deutsche Bank

Global Gold Reserves vs. Global Dollar Reserves

Global Gold Reserves vs. Global Dollar Reserves Amid rising geopolitical tensions and a shifting global financial landscape, central banks worldwide are increasingly favoring gold over the U.S. dollar as a reserve asset. Image: Blomberg

S&P 500 Performance After a Negative Q1 and Then a >10% Q2

S&P 500 Performance After a Negative Q1 and Then a >10% Q2 The 2025 market exhibits a favorable pattern: a negative Q1 followed by a strong Q2 rebound of over 10%. Historically, Q3 has consistently risen by an average of 7.7%, and the rest of the year has seen an average increase of 15.9%. Image:…

Average Annual Inflation of 152 Countries Since 1971

Average Annual Inflation of 152 Countries Since 1971 The post-Bretton Woods monetary system features greater inflation variability and generally higher average inflation, making it difficult for countries to keep inflation consistently below 2% over the long term. Image: Deutsche Bank

S&P 500 / WTI Spot Price, Detrended

S&P 500 / WTI Spot Price, Detrended The roughly 30-year cycle in the relationship between U.S. stock market returns and oil prices highlights periods when stocks are either expensive or cheap relative to oil. Image: Gavekal, Macrobond

S&P 500 Index Returns Based on 4-Year Presidential Cycle

S&P 500 Index Returns Based on 4-Year Presidential Cycle Post-election years typically bring strong market gains. Since 1985, the S&P 500 has averaged gains of over 18%, with positive returns in 90% of cases. The real concern, however, lies in the year that follows. Image: Carson Investment Research

Sentiment Indicator – Investor Equity Positions

Sentiment Indicator – Investor Equity Positions Hedge funds are currently more bullish on the market compared to other investor categories, which remain cautious and have not significantly increased their market participation. Image: Goldman Sachs Global Investment Research

S&P 500 Index Quarterly Returns Based on the Four-Year Presidential Cycle

S&P 500 Index Quarterly Returns Based on the Four-Year Presidential Cycle In post-election years, Q1 tends to be weak. Q2 often shows stronger performance, while Q3 usually experiences some weakness. As the saying goes, “History doesn’t repeat itself, but it often rhymes.” Image: Carson Investment Research

Bottom-Up Consensus S&P 500 EPS Estimates

Bottom-Up Consensus S&P 500 EPS Estimates Bottom-up consensus estimates show S&P 500 EPS growth slowing to 4% year-over-year in Q2 2025, highlighting a cautious earnings environment amid ongoing revisions and sector challenges. Image: Goldman Sachs Global Investment Research