U.S. Equities – S&P 500 Equal Weight Index / S&P 500 Index
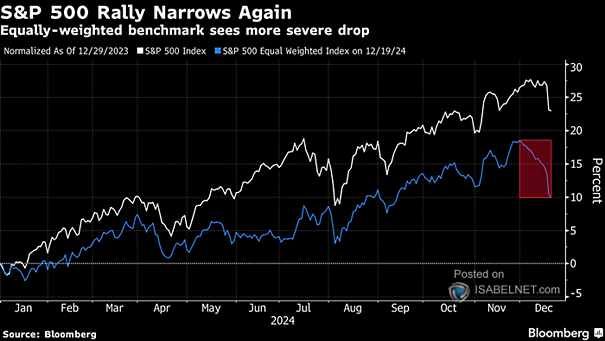
U.S. Equities – S&P 500 Equal Weight Index / S&P 500 Index The ratio of the equal-weighted S&P 500 to its cap-weighted version has dropped to its weakest level since May 2003—a stark reminder of how top-heavy this market has become, with a handful of megacaps driving the rally. Image: Bloomberg