Nasdaq 100 Index and 200-Day Moving Average
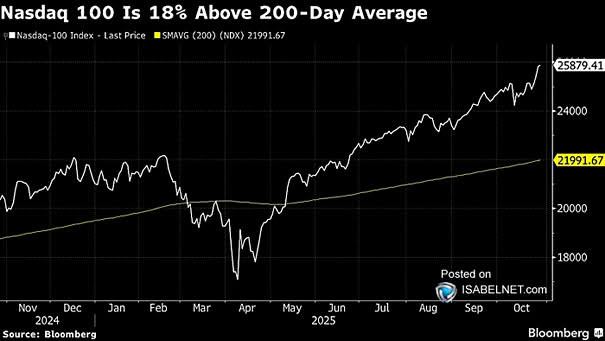
Nasdaq 100 Index and 200-Day Moving Average The Nasdaq 100 keeps ripping higher, but its widening gap from the 200-day average is starting to blink red for a possible 5%–10% pullback. Image: Bloomberg
Nasdaq 100 Index and 200-Day Moving Average The Nasdaq 100 keeps ripping higher, but its widening gap from the 200-day average is starting to blink red for a possible 5%–10% pullback. Image: Bloomberg
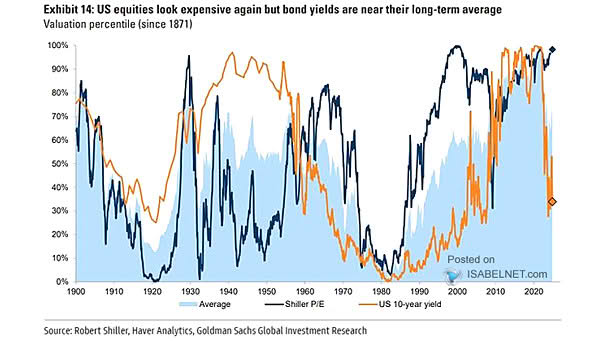
Valuation – Shiller P/E and U.S. 10-Year Yield Sure, U.S. equities are expensive, but inflation and debt worries make bonds no easy refuge either. The smart move now? Stay selective, not scared. Image: Goldman Sachs Global Investment Research
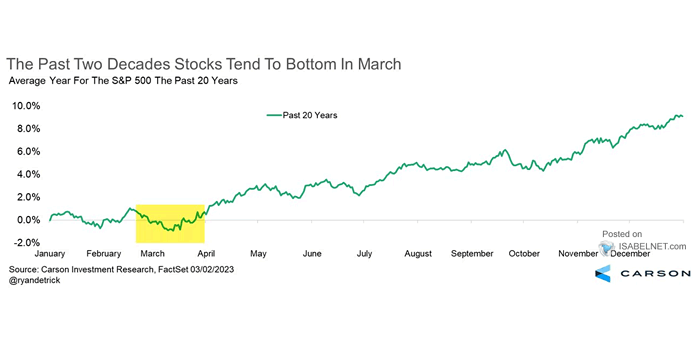
Returns – Average Year for the S&P 500 October 27 has a curious pull on markets — a date when U.S. stocks often find a floor before seasonal inflows spark a late‑year surge. Image: Carson Investment Research
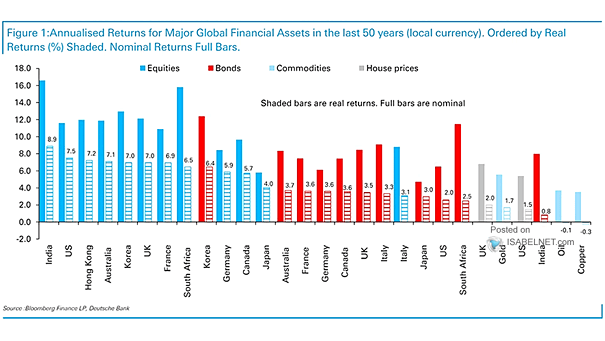
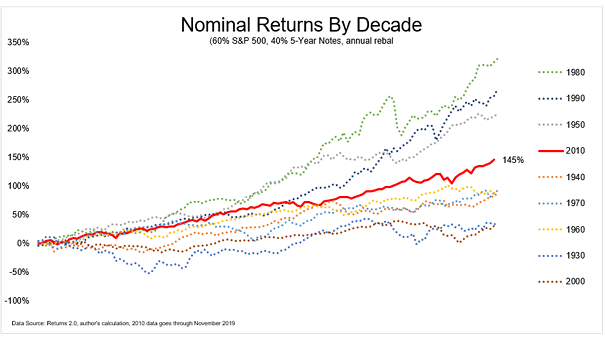
Median Global Real Return in USD by Asset Class While the 60/40 portfolio can’t match stocks in full bull mode, its long-run performance comes surprisingly close — a reminder that bonds still ground both risk and reward in a disciplined portfolio. Image: Deutsche Bank
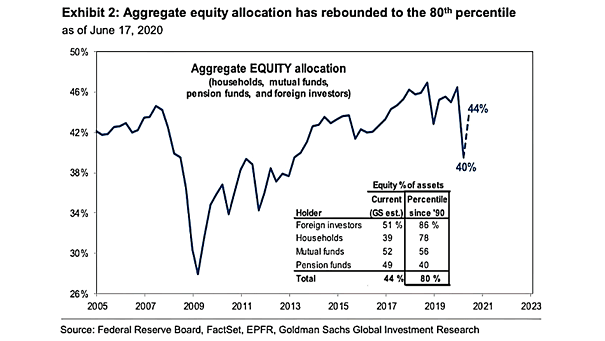
Equity Allocation as % of Household Financial Assets Equities dominate household portfolios in the U.S., Australia, and Sweden, but caution still rules in Europe and Japan, where cash and liquid assets remain king. Image: Goldman Sachs Global Investment Research
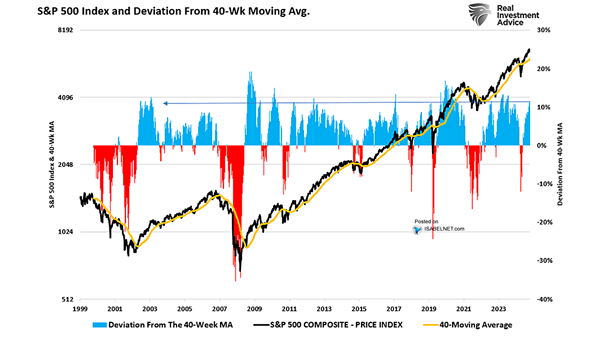
S&P 500 Index and Deviation from 40-Week Moving Average The further the S&P 500 drifts from its 40-week moving average, the harder the reversion’s likely to be. It’s not a bear market call — just a reminder that momentum cuts both ways. Image: Real Investment Advice
S&P 500 Index – Seasonal 3-Month Forward Return Historically, this is go-time for the S&P 500. If past trends hold, the next three months could deliver some of the index’s strongest cumulative gains. Image: Renaissance Macro Research
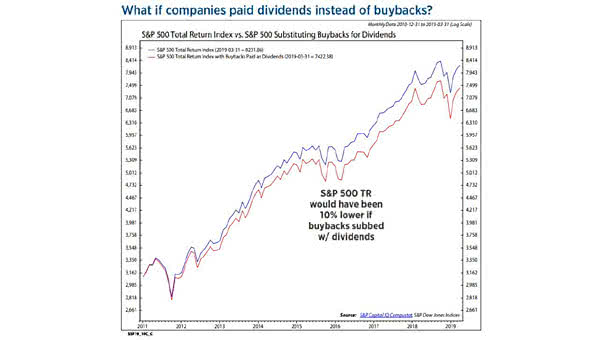
Buyback Aristocrats vs. Dividend Aristocrats Fueled by growth momentum and turbo‑charged buybacks, Buyback Aristocrats have left Dividend Aristocrats in the dust, as investors chase upside over income stability. Image: Goldman Sachs Global Investment Research
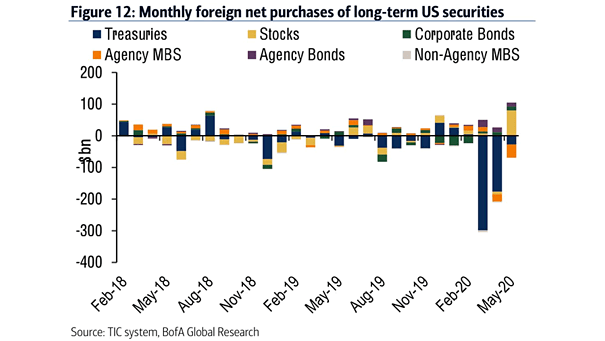
Monthly Foreign Net Purchases of Long-Term U.S. Securities Record foreign holdings of U.S. assets in 2025 point to lasting investor confidence, even in the face of global economic and geopolitical risks. Image: Bloomberg
Returns – Global Equities vs. Global Bonds vs. Gold vs. World Portfolio Since 1950, the world portfolio has earned a real 4.1% annual return — global equities led with 7.3%, gold lagged at 2.5%, and global bonds barely reached 1.8%. The long-run verdict is clear: equities have won. Image: Goldman Sachs Global Investment Research
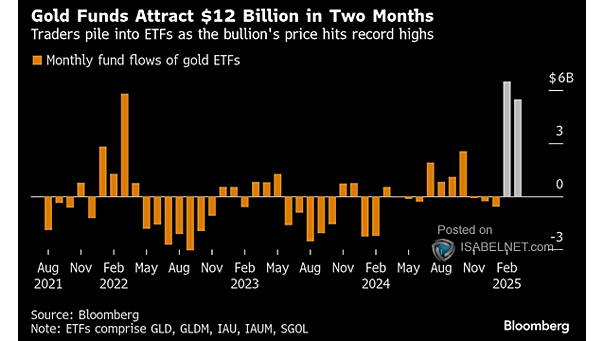
Total Known Gold ETFs Holdings Gold’s shine isn’t fading. ETF holdings just hit a three‑year high, and even with this week’s selloff, gold prices are still up over 50% this year. Image: Bloomberg