Sector Implied Volatility Spread vs. S&P 500
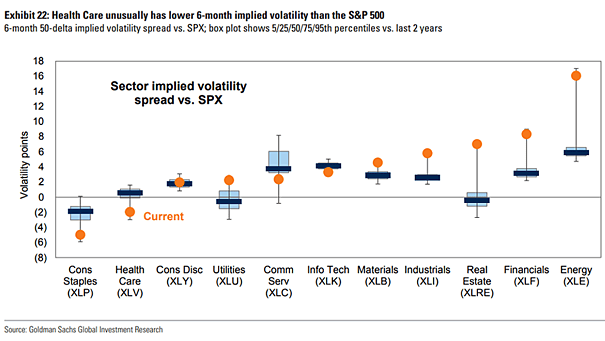
Sector Implied Volatility Spread vs. S&P 500 More volatility to come for health care? Image: Goldman Sachs Global Investment Research
Sector Implied Volatility Spread vs. S&P 500 More volatility to come for health care? Image: Goldman Sachs Global Investment Research
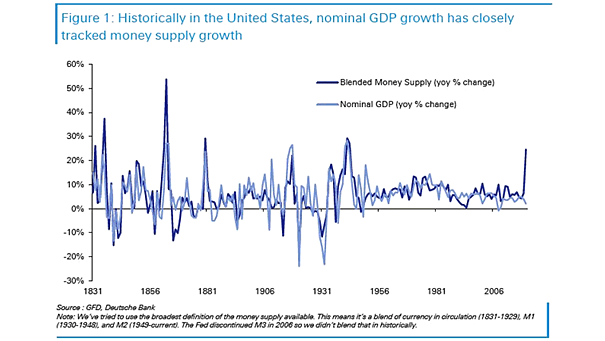
Blended Money Supply vs. U.S. Nominal GDP Historically, U.S. nominal GDP growth tends to track money supply growth. More inflation to come? Image: Deutsche Bank
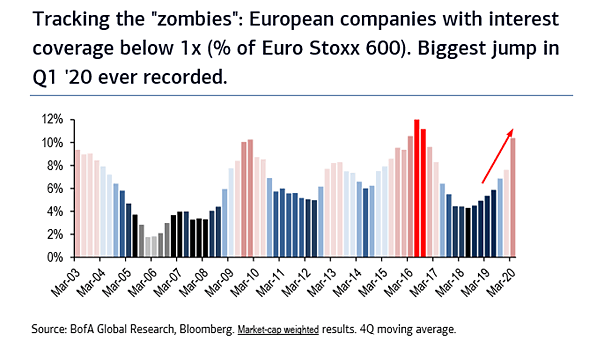
Wave of Zombie Companies in Europe Zombie companies in Europe are back on the rise, thanks to an unprecedentedly easy monetary policy. Image: BofA Global Research
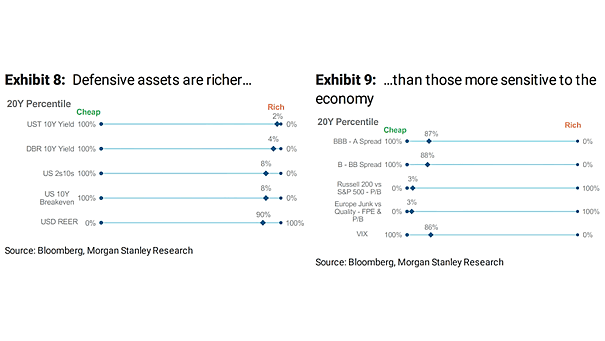
Valuation – Defensive Assets vs. Assets More Sensitive to the Economy Valuations suggest that we’re a long way from a return to normal times, as the market remains concerned about long-term growth. Image: Morgan Stanley Research
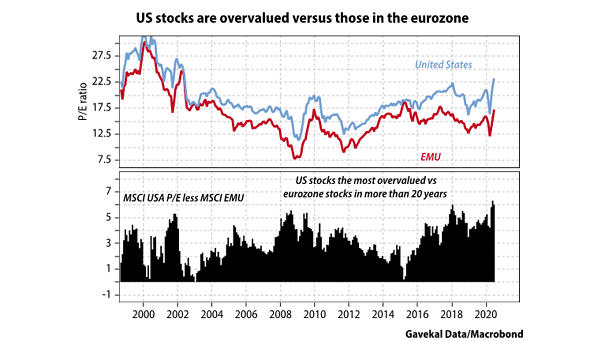
Valuation – U.S. Stocks vs. Eurozone Stocks Will eurozone stocks outperform U.S. stocks in coronavirus recovery? Image: Gavekal, Macrobond
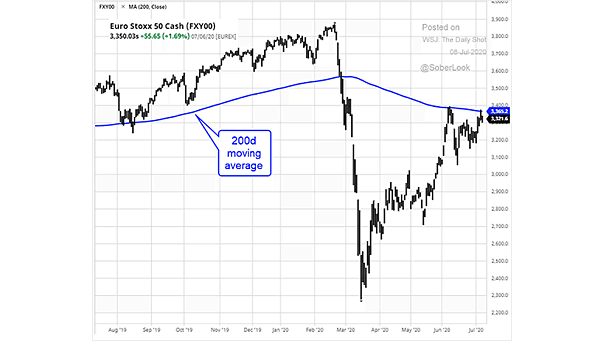
Euro Stoxx 50 and 200-Day Moving Average The Euro Stoxx 50 is testing its 200-day moving average, suggesting some resistance for further gains. Image: The Daily Shot
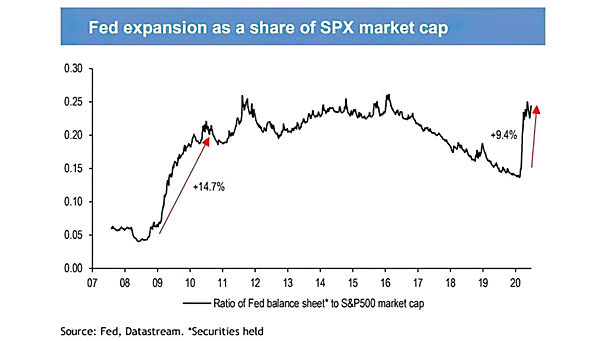
Fed Expansion as a Share of S&P 500 Market Capitalization Fed’s purchases are positive for the stock market, but as a share of S&P 500 market capitalization, they are less than during the 2008-2009 period. Image: J.P. Morgan
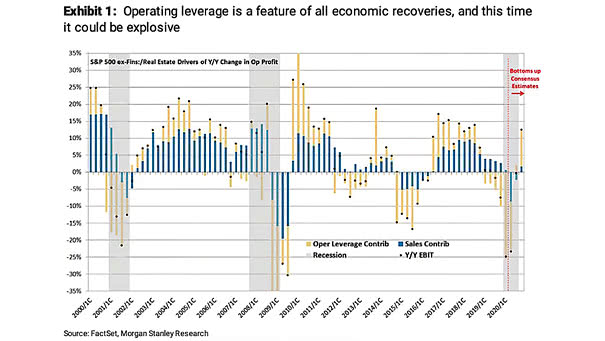
Operating Leverage Contribution and Earnings Rebound Morgan Stanley expects operating leverage to fuel an earnings rebound, through aggressive cost-cutting measures. Image: Morgan Stanley Research
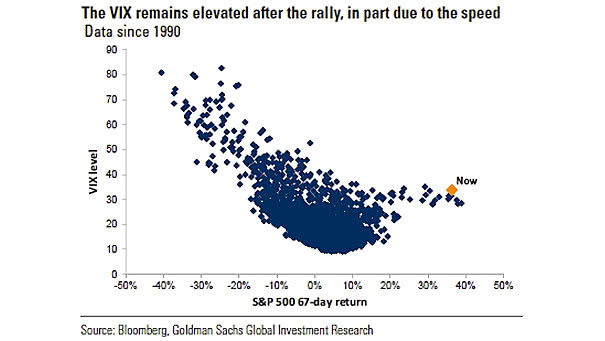
Volatility – VIX Level and S&P 500 67-Day Return The speed of the rally could partly explain why the VIX remains high. Image: Goldman Sachs Global Investment Research
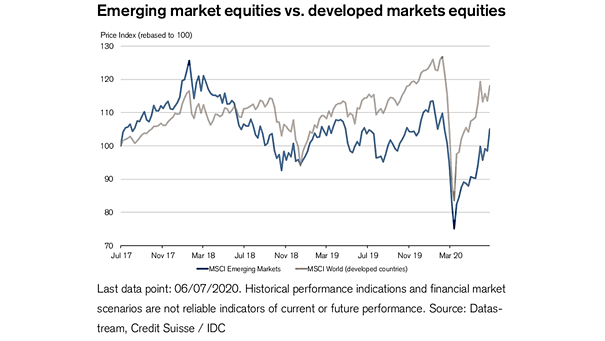
Emerging Market Equities vs. Developed Markets Equities Emerging market equities have underperformed their developed market counterparts. Image: Credit Suisse Research
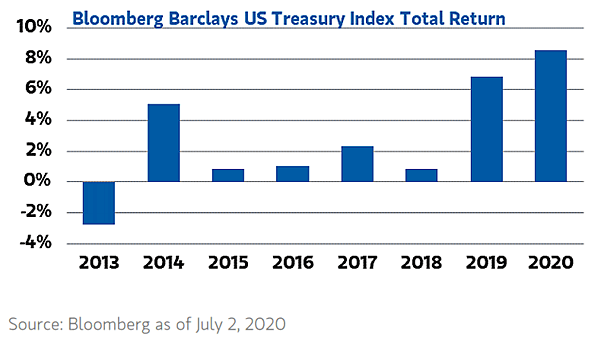
Bloomberg Barclays U.S. Treasury Index Total Return U.S. Treasuries have recorded their strongest performance in the past seven years, thanks to Fed stimulus. Image: Morgan Stanley Research