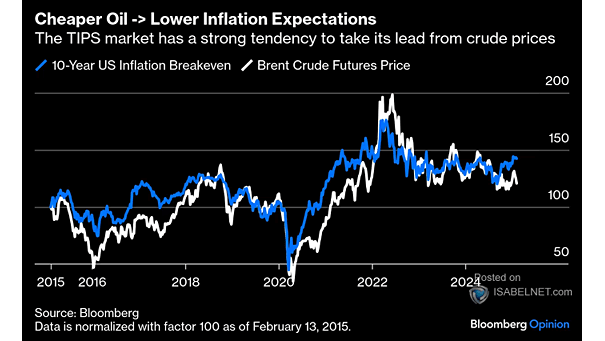
Consolidated Equity Positioning

Consolidated Equity Positioning Consolidated equity positioning is recovering but remains below February levels and continues to be underweight at the 30th percentile, reflecting a cautious environment. Image: Deutsche Bank Asset Allocation

Bottom-Up Consensus S&P 500 EPS Estimates

Bottom-Up Consensus S&P 500 EPS Estimates Bottom-up consensus estimates show S&P 500 EPS growth slowing to 4% year-over-year in Q2 2025, highlighting a cautious earnings environment amid ongoing revisions and sector challenges. Image: Goldman Sachs Global Investment Research

S&P 500 Index

S&P 500 Index The S&P 500 sank earlier in the year due to AI concerns and tariff fears but rebounded impressively to reach record levels, as tariff fears abated, earnings remained strong, and geopolitical risks eased. Image: Bloomberg

S&P 500 Buybacks

S&P 500 Buybacks S&P 500 companies continue robust buybacks at record levels in 2025, demonstrating strong capital deployment, with repurchases projected to exceed $1 trillion this year. Image: Deutsche Bank Asset Allocation

S&P 500 Sector P/E Valuations Relative to History

S&P 500 Sector P/E Valuations Relative to History Valuation metrics indicate that certain S&P 500 sectors remain persistently overvalued compared to both their historical averages and other sectors. Image: Goldman Sachs Global Investment Research

Median 2-Week S&P 500 Returns

Median 2-Week S&P 500 Returns Since 1950, the first half of July has consistently been a seasonally strong period for the S&P 500, making it the best half-month of the year. Image: Goldman Sachs Global Investment Research

S&P 500 Target

S&P 500 Target Goldman Sachs forecasts the S&P 500 to reach 6,100 by year-end and 6,500 within the next year, based on stronger economic growth, improved earnings prospects, and reduced risks related to trade tensions and recession. Image: Goldman Sachs Global Investment Research

New S&P 500 Index All-Time Highs Per Year

New S&P 500 Index All-Time Highs Per Year The S&P 500 hit a new record high, driven by robust corporate earnings and optimism about economic growth. Such periods of record-breaking performance typically occur in clusters and frequently pave the way for additional gains. Image: Carson Investment Research

U.S. Heavy Truck Sales and Recessions (Leading Indicator)

U.S. Heavy Truck Sales and Recessions (Leading Indicator) U.S. heavy truck sales fell in May to 450K (annualized). Before recessions, heavy trucks sales tend to peak and then decline, providing insights into the overall health of the U.S. economy as a leading economic indicator. Click the Image to Enlarge

Sentiment Indicator and Stock Positioning

Sentiment Indicator and Stock Positioning Goldman Sachs’ U.S. Equity Sentiment Indicator currently stands at -0.1. Historically, readings at this level have tended to be followed by gains in the S&P 500 over the following month. Image: Goldman Sachs Global Investment Research