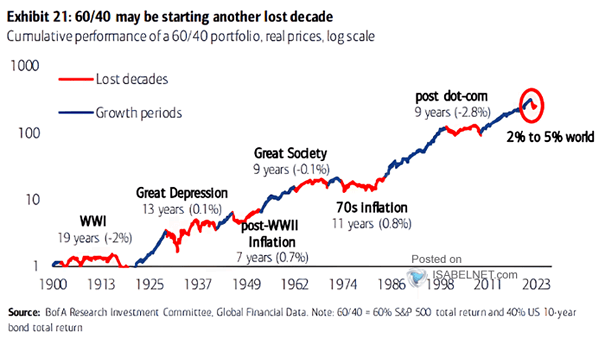
Bloomberg’s Global 60/40 Equity/Fixed Income Portfolio

Bloomberg’s Global 60/40 Equity/Fixed Income Portfolio The global 60/40 portfolio has hit a record high, showing fresh momentum and reaffirming its role as a cornerstone for investors seeking balance and steady long-term gains. Image: Deutsche Bank
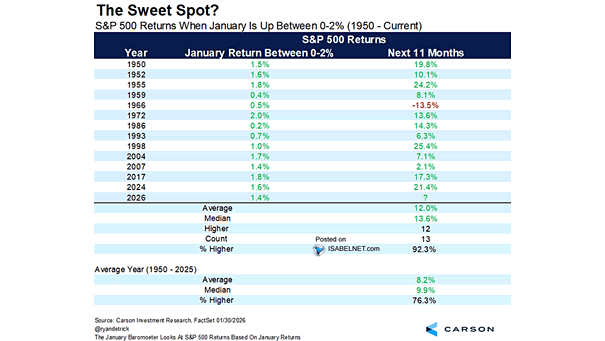
S&P 500 Returns When January Is Up Between 0-2%

S&P 500 Returns When January Is Up Between 0-2% The bulls have history on their side: when the S&P 500 gains between 0% and 2% in January, the next 11 months have gone higher 92% of the time since 1950, posting a median gain of 13.6%. Image: Carson Investment Research

Gold vs. 50/50 S&P 500 and U.S. Treasuries

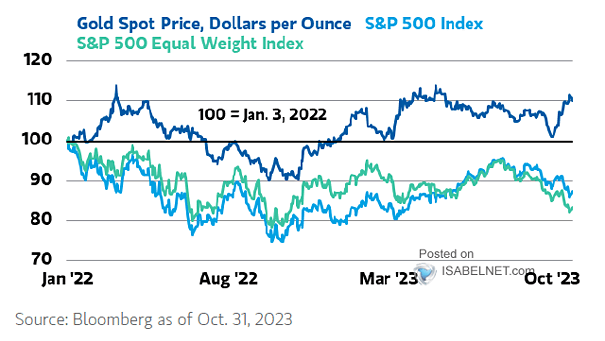
Gold Price vs. S&P 500 Gold has recently surpassed $5,000 per ounce, but it still looks cheap next to a balanced 50/50 portfolio of U.S. stocks and Treasuries. Image: Bloomberg

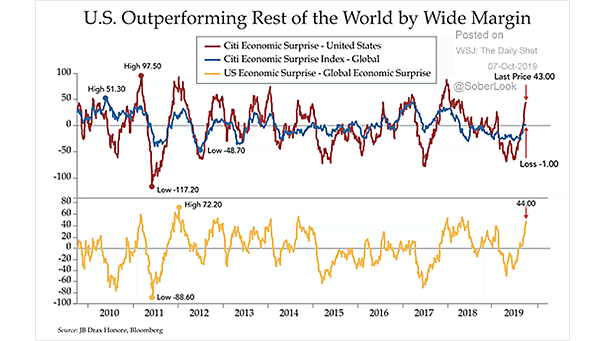
U.S. and Global Economic Surprises

U.S. and Global Economic Surprises Global economic surprises have surged to a two‑year high, with the U.S. gaining momentum, a mix that usually bodes well for stocks and credit in the near term. Image: Societe Generale Cross Asset Research

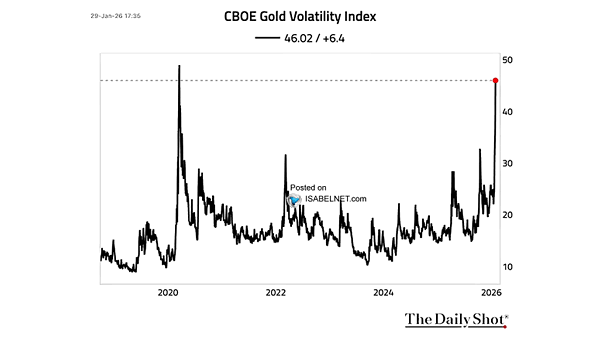
CBOE Gold Volatility Index

CBOE Gold Volatility Index Gold has been getting jumpy lately, with volatility back to levels we haven’t seen since the COVID market chaos. The metal doesn’t panic easily, but when it does, there’s usually a good reason. Image: The Daily Shot

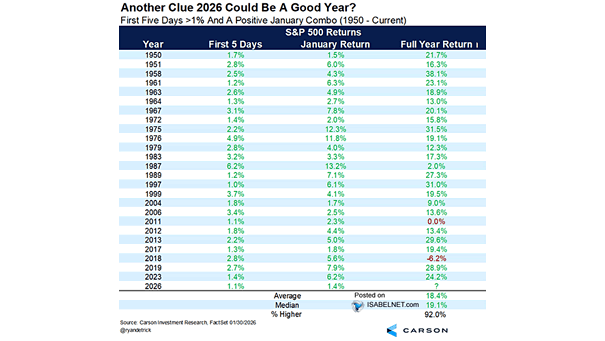
S&P 500 Returns – First Five Days >1% and a Positive January Combo

S&P 500 Returns – First Five Days >1% and a Positive January Combo History favors the bulls: when the S&P 500 rises more than 1% in the first five days and January closes in the green, the market has finished the year higher 92% of the time, with a median 19.1% gain since 1950. Image:…

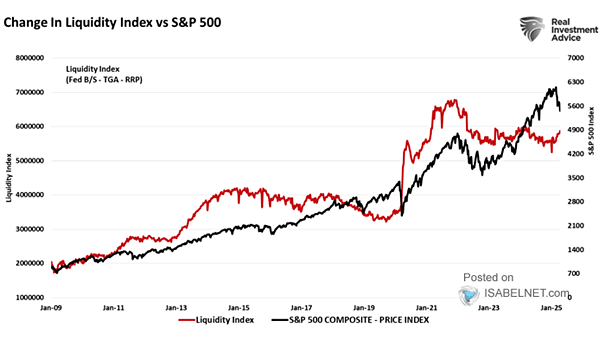
S&P 500 and Liquidity

S&P 500 and Liquidity Liquidity stays abundant. But since 2022, dip-buyers have stopped tracking liquidity and started trading on Fed whispers, reading signals more than balance sheets. Image: Real Investment Advice

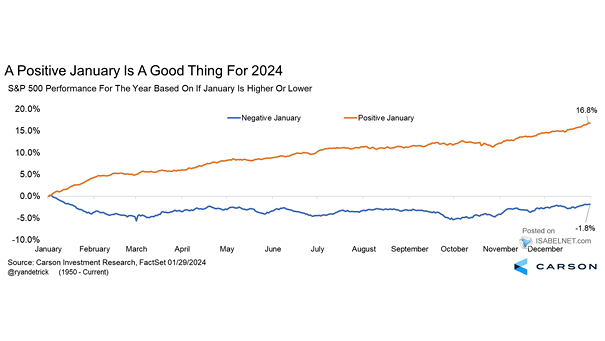
S&P 500 Index Returns Based on If January Is Higher or Lower

S&P 500 Index Returns Based on If January Is Higher or Lower Bulls have reason to smile: a positive January often sets the tone for a bullish year. When the S&P 500 finishes the month higher, history shows full-year gains averaging 16.9% since 1950. Image: Carson Investment Research

U.S. Dollar Index (DXY)

U.S. Dollar Index (DXY) A steady U.S. dollar holding its range might be just what traders and markets need. But let it slip below 90 with conviction, and sentiment can turn quickly: what once looked like a healthy pause starts to look like a dollar problem. Image: MarketDesk Research

S&P 500 Buybacks vs. S&P 500 Composite 12-Month Trailing EPS

S&P 500 Buybacks vs. S&P 500 Composite 12-Month Trailing EPS Corporate buybacks and earnings growth have risen hand in hand. Much of that growth, though, reflects companies lifting their own share prices. With valuations stretched, investors should ask what they’re really paying for. Image: Real Investment Advice