Economic Growth in China
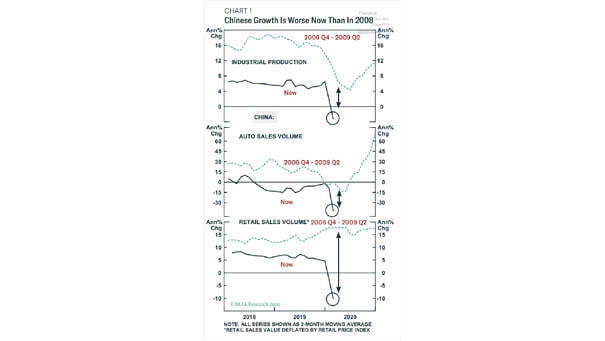
Economic Growth in China As the chart shows, Chinese growth is worse than in 2008. Image: BCA Research
Economic Growth in China As the chart shows, Chinese growth is worse than in 2008. Image: BCA Research
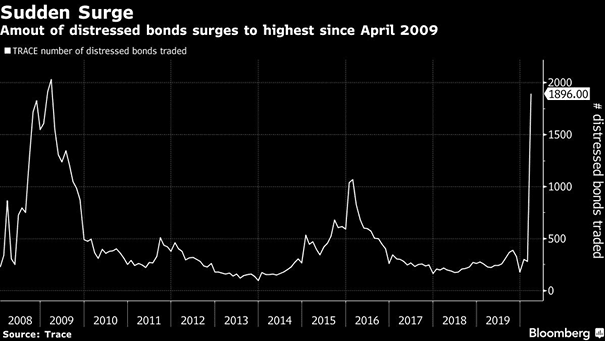
Amount of Distressed Bonds Driven by the coronavirus pandemic and the collapse of oil prices, the amount of distressed bonds has surged to the highest level since 2009. Image: Bloomberg
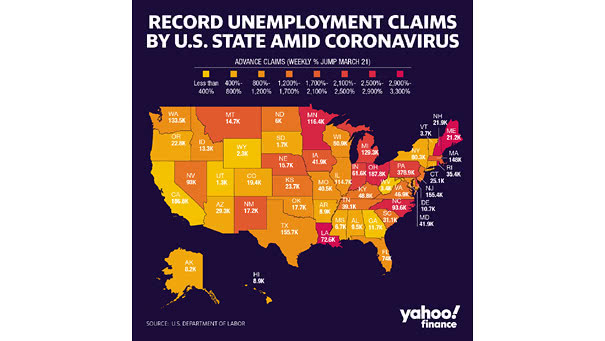
U.S. Jobless Claims by States Coronavirus job losses hit the following states the hardest. Image: Yahoo Finance
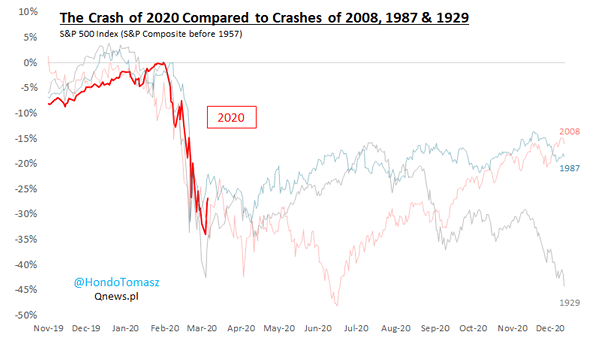
S&P 500 Index – The Crash of 2020 Compared to Crashes of 2008, 1987 and 1929 This chart compares the current decline with 2008, 1987 and 1929 crashes. Image: Tomasz Hońdo
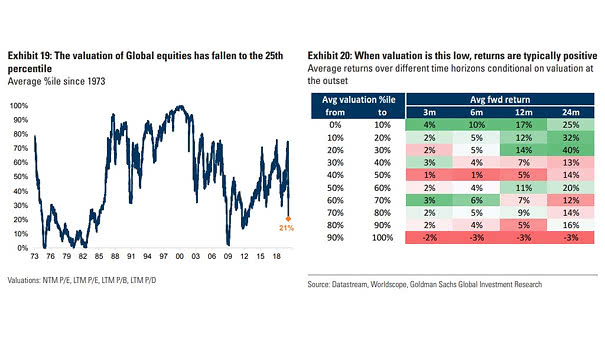
Valuation of Global Equities When valuation of global equities is this low, returns are typically positive Image: Goldman Sachs Global Investment Research
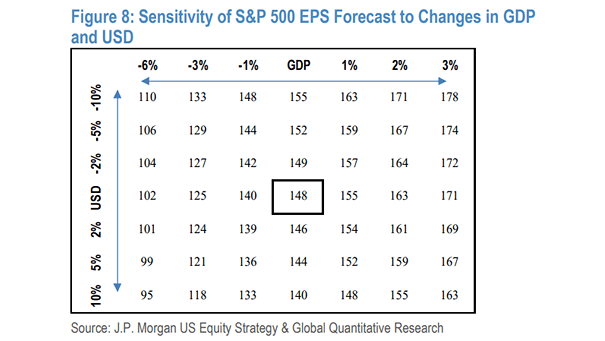
Sensitivity of S&P 500 EPS Forecast to Changes in GDP and the U.S. Dollar This table suggests the sensitivity of S&P 500 EPS forecast to changes in GDP and the U.S. dollar. Image: J.P. Morgan US Equity Strategy & Global Quantitative Research
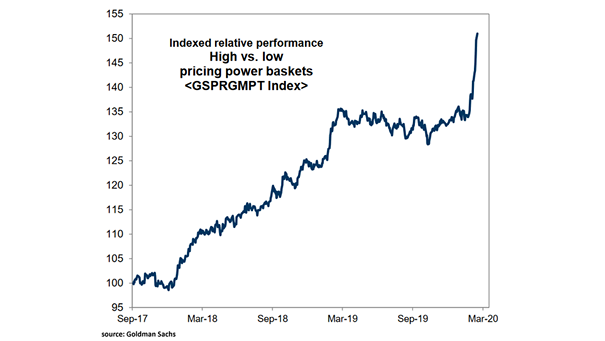
High vs. Low Pricing Power and Stocks Performance Companies with a high pricing power have outperformed significantly in recent years. Image: Goldman Sachs Global Investment Research
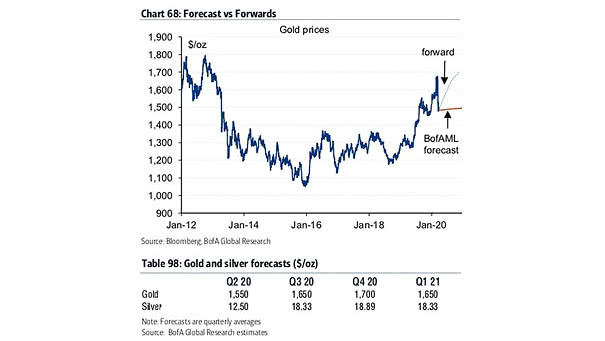
Gold and Silver Forecasts Bank of America forecasts gold price $1700 by year-end. Image: BofA Global Research
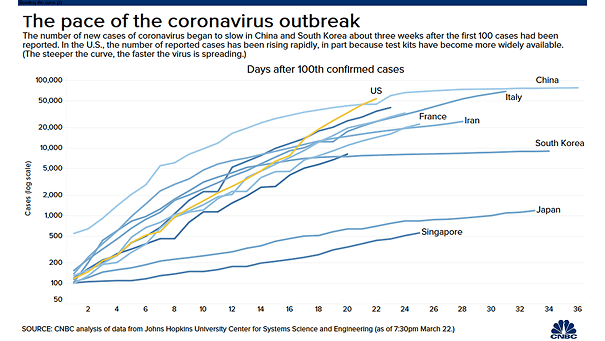
The Pace of the Coronavirus Outbreak The number of confirmed coronavirus cases continues to grow rapidly in the United States. Image: CNBC
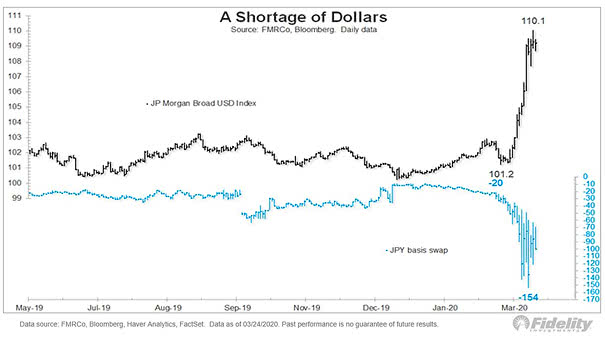
Shortage of U.S. Dollar A severe shortage of U.S. dollar could contribute to a decline in the volume of trade. Image: Fidelity Investments
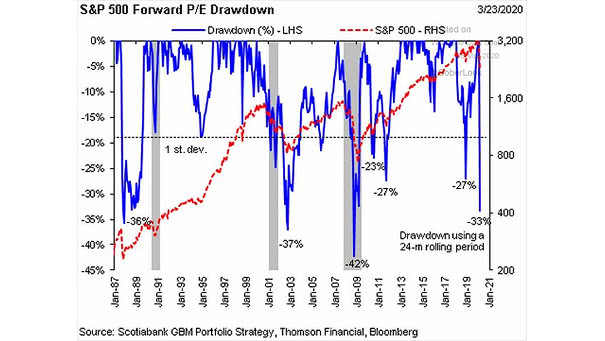
S&P 500 Forward P/E Drawdown This chart puts the S&P 500 forward P/E drawdown into perspective. Image: Scotiabank GBM Portfolio Strategy