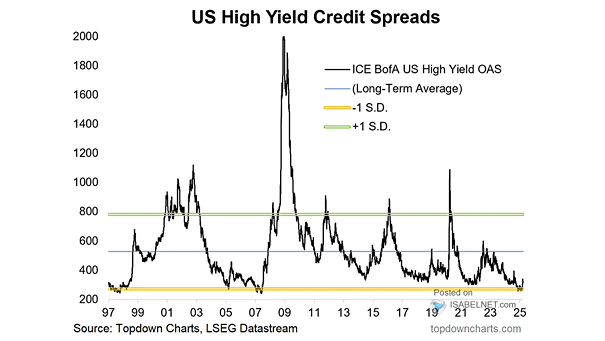
U.S. High Yield Credit Spreads
U.S. High Yield Credit Spreads Tight high-yield spreads signal strong market confidence, but they also raise red flags by potentially masking underlying vulnerabilities and feeding investor complacency by making risks seem less significant than they are. Image: Topdown Charts