ISM Composite Index vs. Recessions
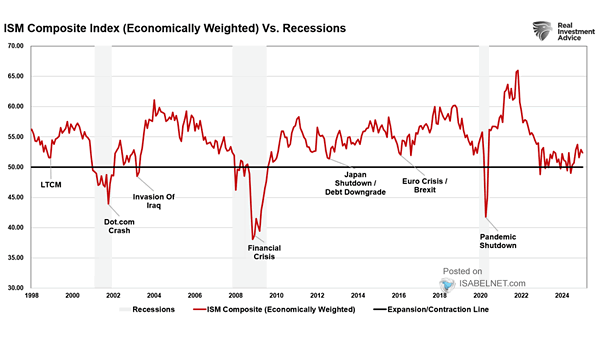
ISM Composite Index vs. Recessions The economically weighted ISM composite paints a picture of moderation. Growth has cooled, not cracked. Image: Real Investment Advice
ISM Composite Index vs. Recessions The economically weighted ISM composite paints a picture of moderation. Growth has cooled, not cracked. Image: Real Investment Advice
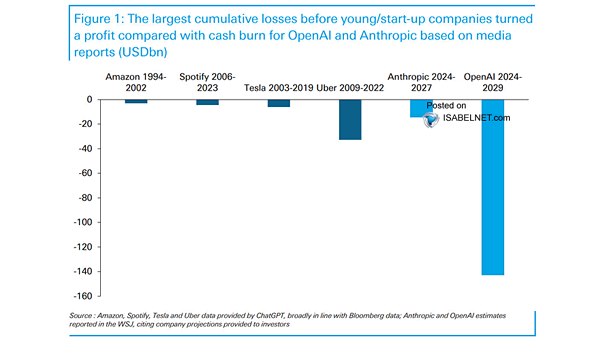
The Largest Cumulative Losses Before Young/Start-Up Companies Turned a Profit As OpenAI’s revenue rises, the question looms: can it reach profitability by 2029 while spending so heavily to fuel the AI race? Image: Deutsche Bank
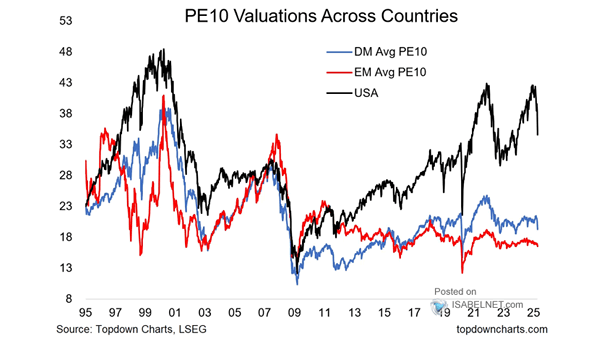
U.S. Valuations: PE10 Ratio The PE10 ratio points to U.S. mid- and small-cap stocks as a valuation sweet spot and potentially poised for better future returns than large caps. Image: Topdown Charts
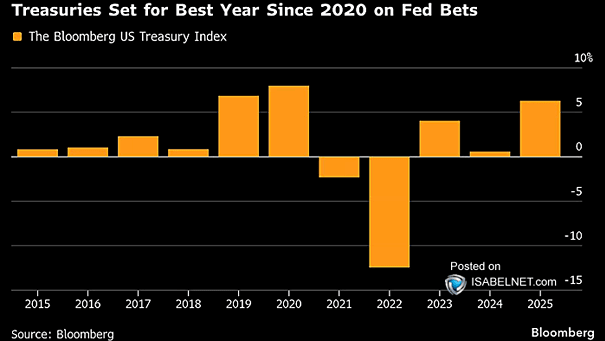
U.S. Treasury Index – Annual Return U.S. Treasuries are on track for their strongest annual performance since 2020, lifted by Fed rate cuts and a cooling labor market that is fueling bets on more monetary easing. Image: Bloomberg
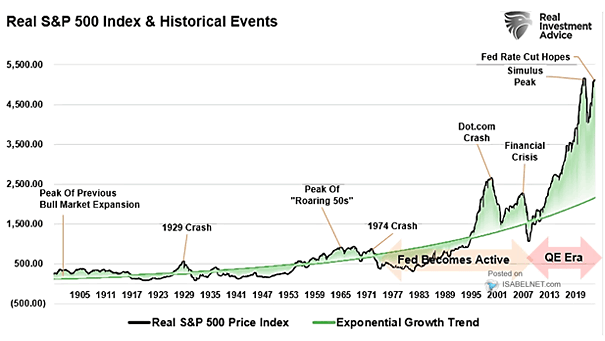
Real S&P 500 Index The current market cycle still feels incomplete. After strong rallies, markets often retreat to test previous highs. That pullback, though painful, often clears the air and sets up the next move higher. Image: Real Investment Advice
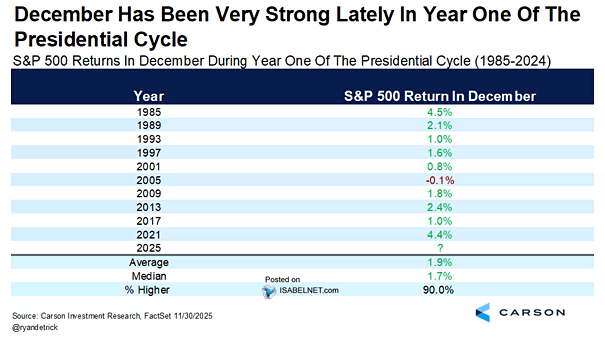
S&P 500 Returns in December During Year One of the Presidential Cycle U.S. stocks have finished December in the red during the first year of the presidential cycle just once in the past 40 years, a record strong enough to keep the bulls smiling with an average 1.9% gain. Image: Carson Investment Research
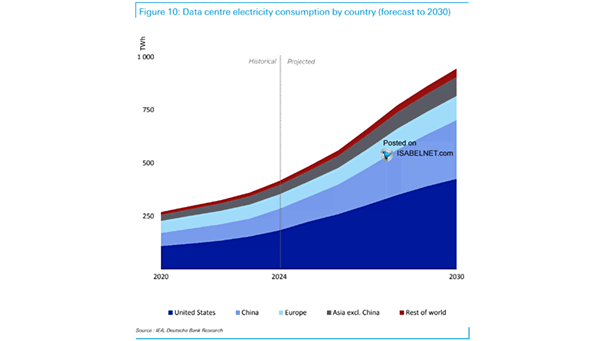
Data Centre Electricity Consumption by Country (Forecast to 2030) Data center electricity use may triple by 2030 due to AI growth, straining energy infrastructure, challenging capacity, sustainability, and reliable power supply across global grids. Image: Deutsche Bank Research
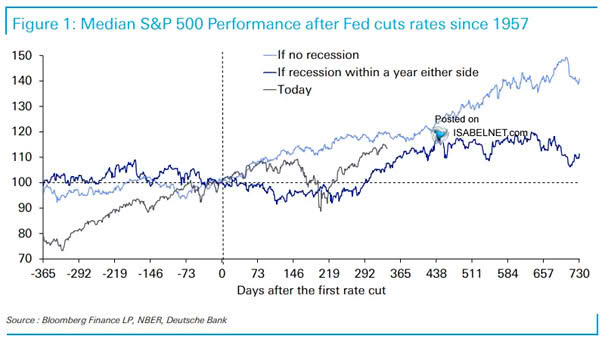
Median S&P 500 Performance After Fed Cuts Rates The S&P 500 has typically rallied about 50% in the two years after the Fed begins cutting rates. But when those cuts hit during recessions, those gains often don’t last. Image: Deutsche Bank
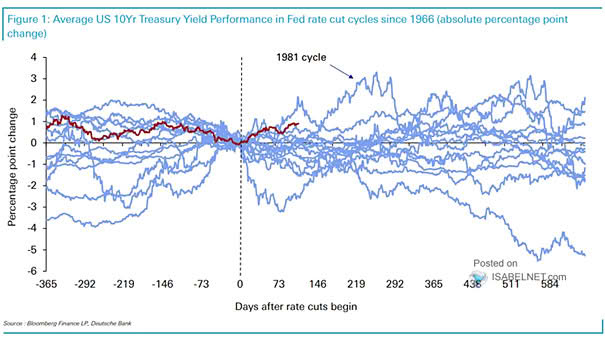
Median U.S. 10-Year Treasury Yield Performance in Fed Rate Cuts Cycles Fed rate cuts usually pull short-term yields lower, but long Treasury bonds don’t always fall in line. Inflation expectations, shifting bets on future policy, or a flood of new debt can just as easily push them higher. Image: Deutsche Bank
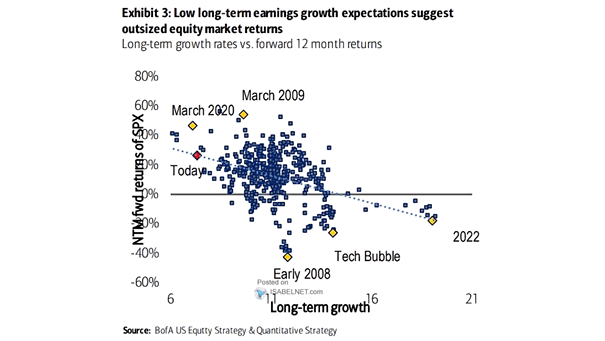
S&P 500 Valuations vs. 6-Month Forward Returns Valuations can help frame long-term return expectations, but they rarely say much about what markets will do in the short run. Image: Goldman Sachs Global Investment Research
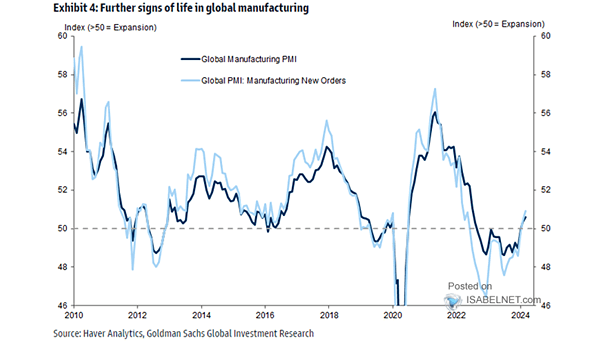
U.S. Manufacturing PMI and Global Leading Indicator Leading indicators are turning higher, signaling a growing chance of a global cyclical upswing into the first half of 2026. Image: Bloomberg