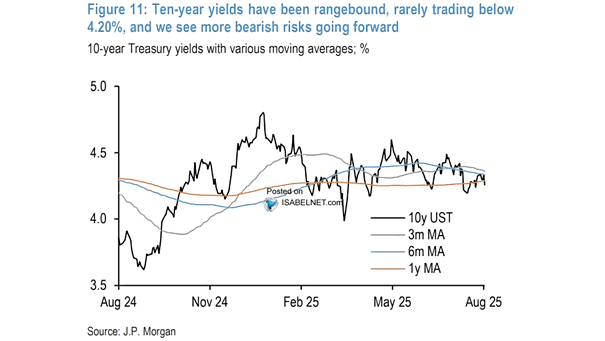
10-Year U.S. Treasury Yields with Various Moving Averages
10-Year U.S. Treasury Yields with Various Moving Averages When the Fed prioritizes the labor market over inflation, it can reduce the immediate risk of recession by sustaining employment. However, this is likely to increase inflation expectations and push yields higher. Image: J.P. Morgan