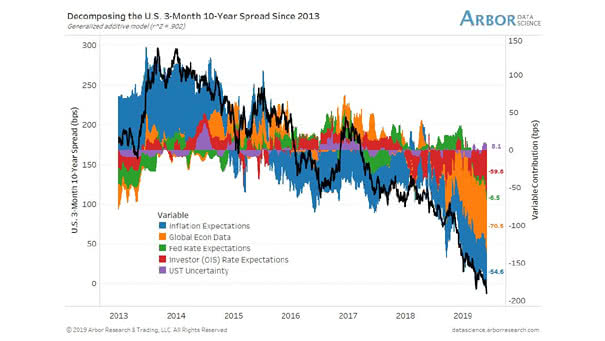
Is Wall Street Overestimating Fed Rate Cut Odds?
Is Wall Street Overestimating Fed Rate Cut Odds? For the first time, the probability of a rate cut is above 80%, and the probability of a rate hike is 0%. Image: Bloomberg
Stages of the Business Cycle as of April 30, 2019 Although global growth remains positive, this chart suggests that most major economies are entering the late business cycle phase. Image: Fidelity Investments
AAII Survey Bullish Votes, Sentix Bullish Votes US Equities, vs. S&P 500 since 2017 Low AAII Sentiment Survey bullish votes of 24.71%, and low Sentix bullish votes for US equities of 12.84%, have corresponded with positive forward returns. Image: Sentix, Bloomberg Finance L.P.
Should Investors Be Concerned About Rising Oil Prices? Because the U.S. becomes entirely self-sufficient, it helps to contain oil prices in the long-term. Cheap oil is good for global economic growth, business and consumers. Image: J.P. Morgan Asset Management
Is the US Expansion Fizzling Out? This chart shows that business investment and consumer expenditure decline in the United States. Image: Deutsche Bank Global Research
S&P 500 Index vs. Earnings per Share since 1989 The consensus S&P 500 earnings for the next 12 months has increased from $173 to $175. Image: Jeroen Blokland
“You Need to Divorce your Mind from the Crowd…” –Warren Buffett Quote of the day: “You need to divorce your mind from the crowd. The herd mentality causes all these IQ’s to become paralyzed. I don’t think investors are now acting more intelligently, despite the intelligence. Smart doesn’t always equal rational. To be a successful…
Utilities-to-Gold & Silver Mining Stocks Ratio Since 1990 S&P 500 Utility Sector to Philadelphia Gold and Silver Index hits all-time high. Image: Crescat Capital LLC
Recession Indicator to Watch: Net Domestic Investment to GDP Net Domestic Investment to GDP is in a long-term downtrend since 1950. It is not a timing indicator for predicting the end of business cycles. But historicammy, before recessions, it tends to peak (red arrow) and then decline (black arrow). Currently, Net Domestic Investment to GDP has a…
One of the Best Indicators to Monitor for Signs a U.S. Recession Is Over The probability of being unemployed in a given month in the United States, by dividing the average initial claims for unemployment insurance by the total number of people working, is one of the best indicators to monitor for signs a U.S.…
What Indicators to Watch for Signs a U.S. Recession Is Coming? 1) In recent history, a recession occurs about 12 to 18 months after the spread between the 30-year and the 3-month treasury yields turns negative (red arrow). When an inverted yield curve occurs, short-term interest rates exceed long-term rates. It suggests that the long-term…