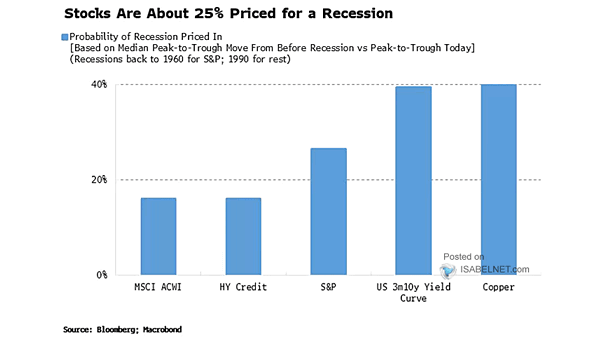
Probability of U.S. Recession As Priced Across Asset Classes
Probability of U.S. Recession As Priced Across Asset Classes The S&P 500 is pricing in about a 25% chance of a recession, which is lower than signals from copper prices or the yield curve, but higher than the recession probabilities implied by global equities or high-yield credit markets. Analysts often use the current percentage change…