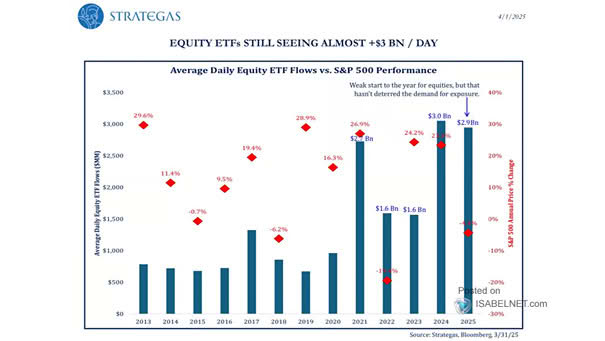
ISABELNET Cartoon of the Day

ISABELNET Cartoon of the Day In the epic showdown of bull vs. bear, the wisest move might just be to sit back, relax, and master “The Art of No Deal”—because sometimes the best trade is no trade at all! Have a Great Day, Everyone! 😎

S&P 500 Dividend Payers / Non-Payers Ratio

S&P 500 Dividend Payers / Non-Payers Ratio Amidst 2025’s market volatility, dividend stocks emerge as a compelling investment, offering both steady income and growth potential while serving as a robust tool for portfolio diversification. Image: Ned Davis Research

Cycle Composite for the S&P 500

Cycle Composite for the S&P 500 While the market may face some choppiness in the near term, the Carson Cycle Composite’s prediction of a strong 2025 for U.S. stocks gives bulls reason for confidence. Image: Carson Investment Research

EPS Growth Estimate

EPS Growth Estimate Despite a downward revision, consensus 2025 EPS growth estimates still project strong earnings growth. Image: Goldman Sachs Global Investment Research

ISABELNET Cartoon of the Day

ISABELNET Cartoon of the Day Wall Street’s bulls thought they’d saved face on Friday with a 1.59% gain for the S&P 500 index, only to realize they’d been running a marathon backwards all week with a 0.97% loss, delighting the bears! Have a Great Week, Everyone! 😎

ISABELNET Cartoon of the Day

ISABELNET Cartoon of the Day February in post-election years is like a bad hangover for bulls: the S&P 500 fell 1.42%, leaving bears to gleefully dance on the trading floor, waving party hats and shouting “I told you so!” Have a Great Weekend, Everyone! 😎

Implied Probability of S&P 500 Drawdown

Implied Probability of S&P 500 Drawdown While the macroeconomic environment may still support U.S. equities, Goldman Sachs’ model indicates an increasing risk of a stock market correction in the next 3 months. Image: Goldman Sachs Global Investment Research

S&P 500 Performance When Higher in January and Lower in February

S&P 500 Performance When Higher in January and Lower in February Since 1950, when the S&P 500 has a positive January followed by a negative February, the index tends to finish the year strong, resulting in gains 75% of the time, with a median increase of 10.1% – better than the average year. Image: Carson…

Top Five Companies % of S&P 500 Market Capitalization

Top Five Companies % of S&P 500 Market Capitalization The S&P 500 is experiencing unprecedented levels of concentration. While the concentration presents potential risks, the fundamentals of the top 5 companies remain strong, with elevated profit margins and robust cash flow generation. Image: Deutsche Bank

S&P 500 Days of the Week Returns

S&P 500 Days of the Week Returns In 2025, U.S. stocks have shown a distinct pattern of performance across different trading days of the week, with Mondays and Fridays experiencing struggles while other weekdays have performed well above the historical average. Image: Deutsche Bank