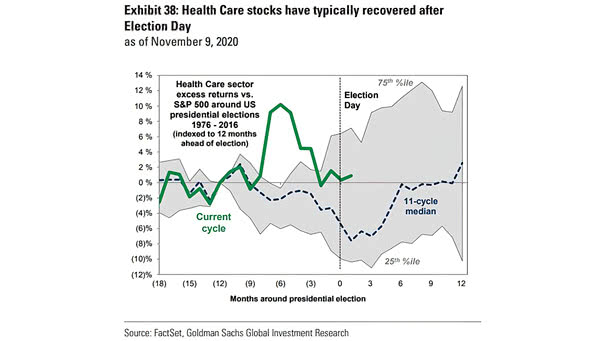
Skip to the content

Advanced Stock Market Forecast for Professionals and Individuals

Connect with Us on X

isabelnet logo

ISABELNET

Advanced Stock Market Forecast for Professional and Individual

Subscribe
SEARCH  
Menu
  • Home
  • Forecasting Models
    • Stock Market Valuation
    • Stock Market Short-Term Forecast
    • Stock Market Equity Risk Premium
    • Stock Market Bull and Bear Indicator
    • Stock Market Long-Term Forecast
    • Stock Market Forecasting Models vs. US Stock Market
    • 95% Correlation, R² = 0.90 since 1970
    • Recession Indicators
    • Leading Indicators
  • Daily Blog
    • All Recent Posts
      • Daily Blog
    • A
      • AAII Sentiment Survey
      • Active
      • Active Fund
      • Active Investing
      • Activity
      • ACWI
      • Aging
      • Algorithmic Trading
      • All-Time High
      • Allocation
      • America
      • Argentina
      • Asia
      • Asset
      • Asset Class
      • Auto Loan
      • Average Claims
      • Average Return
    • B
      • BA-BL
        • Balance Sheet
        • Baltic Dry Index
        • Bank
        • Bank Reserve
        • Banking
        • Baa
        • BBB
        • Bear
        • Bear Indicator
        • Bear Market
        • Benchmark
        • Berkshire Hathaway
        • Bitcoin
        • Black Swan
      • BO-BU
        • BOE
        • BoJ
        • Bond
        • Bond Market
        • Bond Proxies
        • Bond Yield
        • Breadth
        • Brent
        • Brexit
        • Bubble
        • Budget
        • Budget Deficit
        • Bull
        • Bull and Bear Indicator
        • Bull Indicator
        • Bull Market
        • Bund
        • Business
        • Business Confidence
        • Business Cycle
        • Buyback
    • C
      • CA-CE
        • Calendar
        • Canada
        • Capex
        • Capital
        • Capital Expenditures
        • Capitalization
        • Carbon Emission
        • Cash
        • Cash Flow
        • Cass Freight Index
        • CCC
        • CEO
        • CEO Confidence
        • Central Bank
        • CFO
      • CH-CL
        • Chicago Fed National Activity Index
        • Chicago PMI Index
        • China
        • China Credit
        • China Debt
        • China GDP
        • China Manufacturing PMI
        • China Stock Market
        • Chinese
        • Citi Economic Surprise
        • Claims
        • Climate
      • CN-CON
        • CNY
        • CO2
        • CO2 Emission
        • Commercial Bank
        • Commodities
        • Commodity
        • Companies
        • Compensation
        • Compound
        • Concentration
        • Conference Board
        • Confidence
        • Conflict
        • Consensus
        • Construction
        • Consumer
        • Consumer Confidence
        • Consumer Debt
        • Consumer Expectation
        • Consumer Sentiment
        • Consumer Spending
        • Consumption
      • COP-COS
        • Copper
        • Copper to Gold Ratio
        • Core CPI
        • Core Inflation
        • Core PCE
        • Coronavirus
        • Corporate
        • Corporate Bond
        • Corporate Credit
        • Corporate Debt
        • Corporate Profits
        • Correction
        • Correlation
        • Correlation Matrix
        • Cost
        • Country
      • CP-CY
        • CPI
        • Crash
        • Credit
        • Credit Card
        • Credit Cycle
        • Credit Growth
        • Credit Impulse
        • Credit Spread
        • Crisis
        • Crypto
        • Cryptocurrency
        • Crude Oil
        • Cumulative Flow
        • Currency
        • Cycle
        • Cyclical
    • D
      • Data
      • Debt
      • Debt Ceiling
      • Debt to Equity
      • Debt to GDP
      • Debt Level
      • Defensive
      • Defensive Stock
      • Deficit
      • Deflation
      • Delinquency
      • Democrats
      • Demographics
      • Developed Market
      • Disruption
      • Divergence
      • Diversification
      • Dividend
      • DM
      • Dollar
      • Dow Jones
      • Drawdown
      • Drops
      • Durable
    • E
      • EA-EC
        • Earnings
        • Earnings Estimate
        • Earnings Growth
        • Earnings Revision
        • Earnings Yield
        • EBITDA
        • ECB
        • Economic
        • Economic Cycle
        • Economic Expansion
        • Economic Growth
        • Economic Surprise
        • Economies
        • Economy
      • EL-EQ
        • Election
        • Electric
        • Emerging
        • Emerging Market
        • Empire State Manufacturing Survey
        • Employment
        • Energy
        • EPS
        • EPS Growth
        • EPS Revision
        • Equities
        • Equity
        • Equity Exposure
        • Equity Market
        • Equity Risk Premium
      • ET-EX
        • ETF
        • EUR/USD
        • Euro / US Dollar
        • Euro Area
        • Europe
        • European Equity
        • European Union
        • Eurozone
        • Export
        • Exposure
    • F
      • FA-FE
        • FAANG
        • Fair Valuation
        • Fair Value
        • Fear
        • Fear & Greed Index
        • Fed
        • Fed Funds
        • Fed Insurance Cut
        • Fed Rate
        • Fed Rate Cut
        • Fed Rate Hike
        • Fed Tightening
        • Federal Debt
        • Federal Reserve
        • FedEx
      • FI-FU
        • Financial
        • Financial Conditions
        • Fiscal Policy
        • Fixed Income
        • Flow
        • FOMC
        • Forecast
        • Foreign
        • Foreign Exchange Rate
        • Forex
        • Forward EPS
        • Forward P/E Ratio
        • Free Cash Flow
        • Freight
        • Fund Flow
        • Funds
        • Futures
        • FX
    • G
      • GA-GI
        • G3
        • G7
        • G10
        • Gap
        • GBP
        • GDP
        • GDPNow
        • Generation
        • Geopolitic
        • German
        • Germany
        • Gini Coefficient
      • GLOBAL
        • Global Debt
        • Global Earnings
        • Global Economy
        • Global Employment
        • Global Equity
        • Global Equities
        • Global EPS
        • Global Flow
        • Global GDP
        • Global Growth
        • Global Inflation
        • Global M1
        • Global Manufacturing
        • Global Manufacturing PMI
        • Global Market
        • Global Monetary Policy
        • Global Money Supply
        • Global PMI
        • Global Recession
        • Global Sales
        • Global Stock Market
        • Global Trade
        • Globalization
      • GO-GR
        • Gold
        • Gold Ratio
        • Gold Reserve
        • Goods
        • Government
        • Government Bond
        • Government Debt
        • Greece
        • Gross Margin
        • Growth
        • Growth Stock
    • H
      • Hard Data
      • Health
      • Health Care
      • Heavy Truck Sales
      • Hedge
      • Hedge Fund
      • Hedge Fund Exposure
      • High Yield
      • Historical
      • Home
      • Home Price
      • Home Sales
      • House
      • Household
      • Household Debt
      • Housing
      • Housing Bubble
    • I
      • IF-INS
        • IFO
        • IG Bond
        • Immigrant
        • Import
        • Income
        • India
        • Indicator
        • Industrial
        • Industrial Production
        • Industry
        • Inequality
        • Inflation
        • Inflow
        • Insider
        • Insurance Cut
      • INT-ISM
        • Interest Rate
        • Intrinsic Value
        • Investment
        • Investment Grade
        • Investor
        • Investor Sentiment
        • IPO
        • ISABELNET Cartoon of the Day
        • ISM
        • ISM Composite Index
        • ISM Composite PMI
        • ISM Manufacturing Index
        • ISM Non-Manufacturing Index
    • J
      • Japan
      • Japan Corporate Profits
      • Job
      • Job Growth
      • Job Openings
      • Jobless Claims
      • Junk Bonds
    • K
      • KC Fed Labor Market Conditions Index
      • Korea
    • L
      • Labor
      • Labor Force
      • Labor Market
      • Large Cap
      • Leading Economic Index
      • Leading Indicators
      • LEI
      • Leverage
      • Leveraged Loan
      • Liquidity
      • Listed Companies
      • Loan
      • Long-Term Trend
      • Low Volatility
      • Lumber
    • M
      • M1-MA
        • M1
        • M2
        • M2 Velocity
        • M&A
        • Madness
        • Manufacturing
        • Manufacturing PMI
        • Map
        • Margin
        • Margin Debt
        • Market
        • Market Capitalization
        • Market Cycle
        • Market Performance
        • Market Return
        • Market Sentiment
        • Market Share
        • Market Valuation
        • Maturity
      • MI-MOR
        • Millionaire
        • Misery Index
        • Momentum
        • Monetary Policy
        • Money Supply
        • Money
        • Money Market
        • Monthly Return
        • Mortgage
        • Mortgage Rate
      • MOV-MU
        • MOVE
        • Moving Average
        • MSCI
        • MSCI ACWI
        • MSCI All Country World Index
        • MSCI Europe
        • MSCI World
        • MSCI World Growth
        • MSCI World Value
        • Multiple
        • Multiple Expansion
        • Mutual Fund
    • N
      • NAAIM
      • NAHB
      • Nasdaq
      • National Debt
      • NBER
      • Negative Rate
      • Negative Yield
      • New High
      • New Home Sales
      • NFIB
      • Nikkei
      • NIPA Profits
      • Non-Manufacturing
      • Nonfarm Payroll
    • O
      • OECD
      • OECD Composite Leading Indicator
      • Oil
      • Oil Market
      • Oil Price
      • Oil Share
      • OPEC
      • Operating Earnings
      • Outbreak
      • Outflow
      • Outlook
      • Outperformance
      • Output Gap
      • Overvaluation
      • Overvalue
    • P
      • PA-PH
        • Passive
        • Passive Fund
        • Passive Investing
        • Payout Ratio
        • Payroll
        • PCE
        • P/E Ratio
        • Performance
        • Personal Consumption Expenditure
        • Philadelphia Semiconductor Index
        • Philly Fed
      • PM-PREM
        • PMI
        • Policy
        • Policy Easing
        • Policy Rate
        • Policy Uncertainty
        • Population
        • Portfolio
        • Prediction
        • Premium
      • PRES-PU
        • President
        • Presidential
        • Presidential Election
        • Price
        • Price Target
        • Private Debt
        • Private Equity
        • Probability
        • Productivity
        • Projection
        • Profit
        • Profit Margin
        • Potential GDP
        • Pullback
    • Q
      • Quant
      • Quantitative Easing
      • Quantitative Tightening
      • Quote
    • R
      • RA-REA
        • R-squared
        • R-Star
        • R&D
        • Rallies
        • Rally
        • Ranking
        • Rate Cut
        • Rate Hike
        • Rates
        • Rating
        • Ratio
        • Real Estate
        • Real GDP
        • Real Yield
      • REA-RET
        • Recession
        • Record High
        • Recovery
        • Reflation
        • Region
        • Repo Market
        • Republicans
        • Repurchase
        • Reserve
        • Retail
        • Retail Sales
        • Return
      • REV-RU
        • Revenue
        • Revision
        • Richmond Fed Survey
        • Risk
        • Risk Appetite
        • Risk Parity
        • Risk Premium
        • Rotation
        • Russell
        • Russia
    • S
      • S&P 500 AL-GA
        • S&P 500
        • S&P 500 All-Time High
        • S&P 500 Bear Market
        • S&P 500 Bull Market
        • S&P 500 Buyback
        • S&P 500 Cycle
        • S&P 500 Dividend
        • S&P 500 Drawdown
        • S&P 500 Earnings
        • S&P 500 Election
        • S&P 500 EPS
        • S&P 500 ETF
        • S&P 500 Gain
      • S&P 500 FO-VO
        • S&P 500 Forecast
        • S&P 500 Future
        • S&P 500 Performance
        • S&P 500 Price
        • S&P 500 Projection
        • S&P 500 Pullback
        • S&P 500 Return
        • S&P 500 Seasonal
        • S&P 500 Short Interest
        • S&P 500 Stock
        • S&P 500 Valuation
        • S&P 500 Volatility
      • SA-SE
        • Sales
        • Saudi Arabia
        • Saving
        • Seasonal
        • Secular
        • Secular Bull Market
        • Securities
        • Sell in May
        • Semiconductor
        • Sentiment
        • Service
      • SH-SM
        • Shale
        • Share Buybacks
        • Shareholder
        • Sharpe Ratio
        • Short Interest
        • Silver
        • Singapore
        • Slope
        • Small Business
        • Small Cap
      • SO-STOC
        • Soft Data
        • South Korea
        • South Korea Export
        • Sovereign
        • Spending
        • Spread
        • Stock Buybacks
        • Stock Market
        • Stocks
      • STOO-SW
        • Stoxx 600
        • Strategy
        • Student Loan
        • Surprise
        • Survey
        • Swan
    • T
      • TA-TI
        • T-Bill
        • Taiwan
        • Target
        • Tariff
        • Tax
        • Tech
        • Term Premium
        • Term Structure
        • Tightening
        • TIPS
      • TRA
        • Trade
        • Trade Balance
        • Trade Conflict
        • Trade Deal
        • Trade Tension
        • Trade War
        • Trading
      • TRE-TW
        • Treasuries
        • Treasury
        • Treasury Holdings
        • Trend
        • Truck
        • Truck Tonnage
        • Trump
        • Twin Deficits
    • U
      • UN
        • Unemployment
        • Unemployment Rate
        • Uncertainty
        • Unicorn
        • United States
        • University of Michigan Consumer Sentiment Index
      • US-UT
        • U.S.
        • U.S. Debt
        • U.S. Dollar
        • U.S. Economy
        • U.S. GDP
        • U.S. PMI
        • USA
        • USD
        • USD/CNY
        • Utilities
        • Utility
    • V
      • Valuation
      • Value
      • Value Stock
      • Velocity
      • Venezuela
      • Virus
      • VIX
      • VIX Term Structure
      • Volatility
      • Volume
    • W
      • WA-WE
        • Wage
        • Wage Growth
        • Wall of Worry
        • Wealth
        • Wealth Inequality
      • WORLD
        • World
        • World Debt
        • World Economy
        • World Equities
        • World EPS
        • World GDP
        • World Growth
        • World Trade
      • WT
        • WTI
    • Y
      • YouTube
        • > All Interviews
        • Charlie Munger
        • Howard Marks
        • Jeffrey Gundlach
        • Ken Fisher
        • Ray Dalio
        • Thomas Russo
        • Warren Buffett
      • Yen
      • Yield
      • Yield Curve
      • Yield Curve Inversion
      • Yield Spread
      • Yuan
    • Z
      • Zombie Companies
    • 2-30
      • 2
        • 2-Year
        • 2-Year Yield
        • 200D
        • 200MA
        • 2s-10s
      • 5
        • 5-Year
        • 5-Year Yield
      • 10
        • 10-Year
        • 10-Year Yield
        • 10Y-2Y
        • 10Y-3M
      • 30
        • 30-Year
        • 30-Year Yield
        • 30Y-10Y
  • Log In
    • Basic Membership
    • Premium Membership
    • Pro Membership
    • Retrieve Your Password
    • Renew Your Visa/MasterCard
    • Log Out
  • Contact
  • FAQ
  • About

Search Results for: presidential election


Euro to U.S. Dollar (EUR/USD) and U.S. Presidential Elections
Nov 09 2020

Euro to U.S. Dollar (EUR/USD) and U.S. Presidential Elections

Euro to U.S. Dollar (EUR/USD) and U.S. Presidential Elections Since 2000, the EUR/USD tends to rise after the U.S. presidential election. Image: Nordea and Macrobond

Percentage of Popular Vote and Electoral College Vote for Winning Candidate in U.S. Presidential Elections Since 1789
Nov 04 2020

Percentage of Popular Vote and Electoral College Vote for Winning Candidate in U.S. Presidential Elections Since 1789

Percentage of Popular Vote and Electoral College Vote for Winning Candidate in U.S. Presidential Elections Since 1789 Winning the popular vote doesn’t ensure victory in the United States. Image: J.P. Morgan

Performance of the S&P 500 on the 10 Days Following U.S. Presidential Elections
Nov 04 2020

Performance of the S&P 500 on the 10 Days Following U.S. Presidential Elections

Performance of the S&P 500 on the 10 Days Following U.S. Presidential Elections The S&P 500 has gained an average 1.7% on the 10 days following U.S. Presidential elections since 1944. Image: Statista

Forward Three-Month S&P 500 Performance Following U.S. Presidential Election
Nov 02 2020

Forward Three-Month S&P 500 Performance Following U.S. Presidential Election

Forward Three-Month S&P 500 Performance Following U.S. Presidential Election The S&P 500 tends to do much better if the President is re-elected. Image: Morgan Stanley Wealth Management

Cumulative U.S. Equity Fund Flows Around U.S. Presidential Elections Since 2004
Oct 21 2020

Cumulative U.S. Equity Fund Flows Around U.S. Presidential Elections Since 2004

Cumulative U.S. Equity Fund Flows Around U.S. Presidential Elections Since 2004 Positive flows into U.S. equity funds could support a further rise in the S&P 500 after the U.S. presidential election. Image: Goldman Sachs Global Investment Research

Health Care Sector Excess Returns vs. S&P 500 Around U.S. Presidential Elections
Oct 10 2020

Health Care Sector Excess Returns vs. S&P 500 Around U.S. Presidential Elections

Health Care Sector Excess Returns vs. S&P 500 Around U.S. Presidential Elections The health care sector tends to underperform through U.S. presidential elections, due to uncertainty about future government policy. Image: Goldman Sachs Global Investment Research

Median S&P 500 Return by Month during Presidential Election Years
Oct 08 2020

Median S&P 500 Return by Month during Presidential Election Years

Median S&P 500 Return by Month during Presidential Election Years Can investors expect a year-end rally this year? Image: Goldman Sachs Global Investment Research

Average S&P 500 Performance Around U.S. Presidential Elections Since 1972
Sep 28 2020

Average S&P 500 Performance Around U.S. Presidential Elections Since 1972

Average S&P 500 Performance Around U.S. Presidential Elections Since 1972 Market volatility is expected to continue ahead of the U.S. presidential election. Image: Nordea and Macrobond

Implied Probability of Vice President Biden Winning 2020 Presidential Election
Sep 25 2020

Implied Probability of Vice President Biden Winning 2020 Presidential Election

Implied Probability of Vice President Biden Winning 2020 Presidential Election Is Joe Biden’s advantage underestimated? Image: Goldman Sachs Global Investment Research

S&P 500 Average Performance - Presidential Election Years & Incumbent Party Outcome 1936-2016
Aug 04 2020

S&P 500 Average Performance – Presidential Election Years & Incumbent Party Outcome 1936-2016

S&P 500 Average Performance – Presidential Election Years & Incumbent Party Outcome 1936-2016 The S&P 500 has been a great indicator in the three months prior to the U.S. presidential election. Historically, the S&P 500’s performance has been 87% accurate in predicting the winner of the election. When the S&P 500’s performance was positive, the…

Average S&P 500 Price Performance - U.S. Presidential Election Results
Jul 27 2020

Average S&P 500 Price Performance – U.S. Presidential Election Results

Average S&P 500 Price Performance – U.S. Presidential Election Results The S&P 500 has been a great indicator in the three months prior to the U.S. presidential election. Image: Strategas Research Partners

Posts navigation

Previous 1 2 3 … 7 Next

RECENT POSTS

The 2009 S&P 500 Bull Market Compared With This One

The 2009 S&P 500 Bull Market Compared With This One

06/21/2025 Off
S&P 500 and Combination of Forward PE, VIX, Bullish Sentiment

S&P 500 and Combination of Forward PE, VIX, Bullish Sentiment

06/21/2025 Off
Fear & Greed Index - Investor Sentiment

Fear & Greed Index – Investor Sentiment

06/21/2025 Off
Different Market Sentiment Indicators

Different Market Sentiment Indicators

06/21/2025 Off
Risk Appetite Indicator Level and Momentum Factors

Risk Appetite Indicator Level and Momentum Factors

06/21/2025 Off

Forecasting Models

  • Stock Market Valuation
  • Stock Market Short-Term Forecast
  • Stock Market Equity Risk Premium
  • Stock Market Bull and Bear Indicator
  • Stock Market Long-Term Forecast
  • Forecasting Models vs. Stock Market
  • 95% Correlation, R² = 0.90 since 1970
  • Recession Indicators
  • Leading Indicators

Daily Blog

  • Daily Blog Posts

About

  • About Isabelnet
  • FAQ
  • Contact
  • Home

Membership

  • Subscribe
  • Basic Membership
  • Premium Membership
  • Pro Membership
  • Retrieve your Password
  • Renew your Visa/MasterCard
  • Log Out

Legal

  • Terms of Use
  • Privacy Policy
  • Legal Notice

Follow Us

Icon Small

© 1998-2025 ISABELNET S.A.

The opinion expressed on this website is for informational & educational purposes only and is not intended as advice to buy or sell securities

The forecasts set forth may not develop as predicted. Past performance is no guarantee, nor is it indicative of future results

Custom Search