U.S. 10-Year/2-Year Yield Curve and Recession
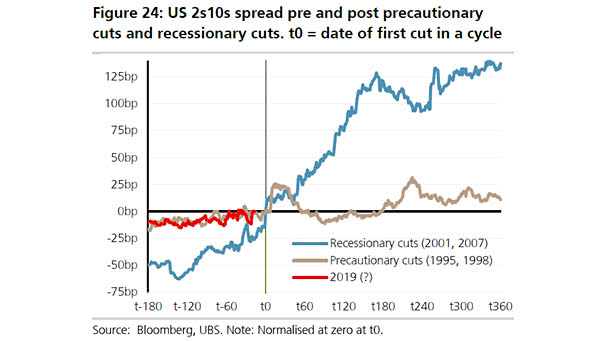
U.S. 10-Year/2-Year Yield Curve and Recession After the first Fed rate cut, a steepening of the U.S. 2-Year/10-Year spread could suggest a recession is coming. Image: UBS
U.S. 10-Year/2-Year Yield Curve and Recession After the first Fed rate cut, a steepening of the U.S. 2-Year/10-Year spread could suggest a recession is coming. Image: UBS
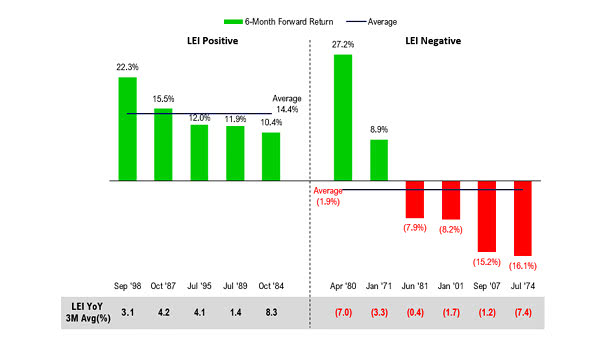
Conference Board U.S. LEI and 6-Month S&P 500 Forward Return A Fed rate cut is good for the S&P 500 when the Conference Board U.S. LEI is positive. Image: Fundstrat Global Advisors, LLC

U.S. Yield Curve vs. Recessions The chart shows the 10-year Treasury yield minus Fed funds rate yield curve and recessions. Historically, a flat or inverted yield curve is associated with slow economic growth or recessions. The longer the yield curve stays inverted, the better it predicts recession. A Fed rate cut similar to 1995 could…
U.S. Recessions since 1957 This chart shows that almost every Fed rate cut has been associated with a recession. Image: John P. Hussman
What is the Biggest Risk Right Now for Investors? What is the Biggest Risk Right Now for Investors? The risk of a Fed policy error The probability of a Fed rate cut in July 2019 is now 84.6%. Image: Bloomberg
Decomposing the U.S. 10-Year minus 3-Month Treasury Yield Spread since 2013 This great chart shows that the “Global Economic Data” variable has a significant impact on the U.S. 10-year minus 3-month Treasury yield spread since 2018. An R² of 0.902 means that more than 90 percent of the variance in the U.S. 10-year minus 3-month Treasury yield spread…
Is Trump Right to Criticize Powell? We don’t think so, because: – Interest rates are still near zero in real terms and below real GDP – The rise in Fed rates has very few visible negative effects in the USA – And at full employment, GDP returns to the level of potential GDP
U.S. NonFarm Employment Annual Growth The YOY job growth rate of 1.1% is a warning sign, as similar levels have coincided with periods just before or during recessions since 1950, supporting the case for the Fed to consider easing monetary policy soon. Image: Paulsen Perspectives
ISABELNET Cartoon of the Day As the Fed leaves rates unchanged and tariff concerns persist, bulls are navigating markets like a plane battling turbulent skies—holding firm and hoping for a break in the storm! Have a Great Day, Everyone! 😎
S&P 500 Dividend Payers / Non-Payers Ratio Amidst 2025’s market volatility, dividend stocks emerge as a compelling investment, offering both steady income and growth potential while serving as a robust tool for portfolio diversification. Image: Ned Davis Research
Long History of U.S. 10-Year Treasury Yields Despite expectations of rate cuts, U.S. interest rates could move in either direction, depending on inflation and Fed decisions. Image: Goldman Sachs Global Investment Research Click the Image to Enlarge