U.S. 30-Year Bond Total Return by Year
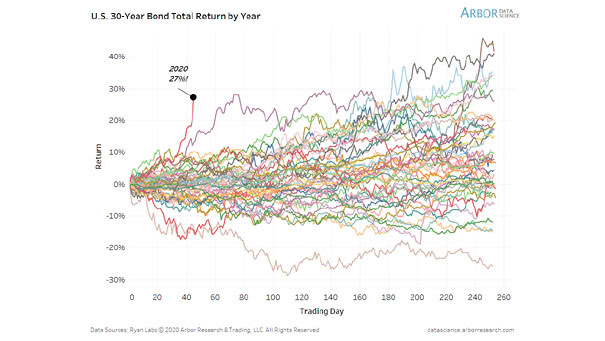
U.S. 30-Year Bond Total Return by Year U.S. long-bond yield hits all-time low, with the world in crisis mode. Image: Arbor Research & Trading LLC
U.S. 30-Year Bond Total Return by Year U.S. long-bond yield hits all-time low, with the world in crisis mode. Image: Arbor Research & Trading LLC
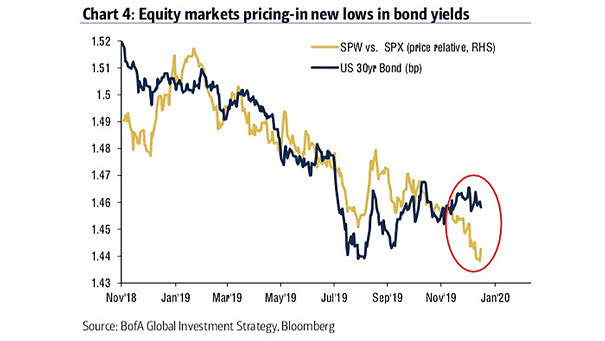
S&P 500 Equal Weight Index vs. S&P 500 (Price Relative) and U.S. 30-Year Bond Equity markets suggest new lows in bond yields. Image: BofA Global Investment Strategy

200D Change in Yield Curve 30Y-10Y Leads U.S. ISM Manufacturing Index This great chart suggests that 200-Day Change in Yield Curve 30-Year minus 10-Year spread leads U.S. ISM Manufacturing Index by 16 months. It also suggests that U.S. PMI is probably bottoming now and could bounce back. Image: Fundstrat Global Advisors, LLC
U.S. Monthly Average 30-Year Fixed Mortgage Rates Keep in mind that mortgage costs are influenced by the 10-year Treasury yield. 30-year mortgage rates = 1.739 x (10-year treasury yield)² + 0.7755 x (10-year treasury yield) + 0.0227(R² = 0.9787) You may also like “30-Year Mortgage Rates vs. 10-Year Treasury Yield.” Image: Leonard Kiefer
Cyclical Stocks Responding to Steepening Long-term Yield Curve Keep in mind that the Fed has little influence on the long end of the yield curve. And currently, the 30-year Treasury rate minus 10-year Treasury rate spread has a normal upward slope, like in the mid-1990s when the economy was growing. The chart below shows that the…
VIX & Yield Curve Cycle Since 2007 This chart also shows that we are in a late business cycle. The spread between the 30-year and the 3-month treasury yields is one of the most interesting spreads to watch. In recent history, a recession occurs about 12 to 18 months after the yield curve inverts. Image:…
Treasury Options and Yield Curve Cycle Since 2007 This great chart shows that we are in a late business cycle. The spread between the 30-year and the 3-month treasury yields is one of the most interesting spreads to watch. In recent history, a recession occurs about 12 to 18 months after the yield curve inverts.…
US Long-Term Mortgage Rates Decline: 30-Year Average 4.10% & 15-Year Average 3.57% Why US long-term mortgage rates decline? Mortgage costs are influenced by the 10-year Treasury yield which was lower this week, because the trade war between the United States and China pushes investors moving money from stocks to bonds. Bond yields fall as prices rise.…
One of the Best Yield Curves to Predict a Recession is Coming The spread between the 30-year and the 3-month treasury yields is one of the best recession signal of all the yield spreads. In recent history, a recession occurs about 12 to 18 months after the yield curve inverts. When an inverted yield curve…
Yield Curve Inversion A yield curve inversion is a necessary condition for a recession, but it is not a sufficient condition. We also need a widening of credit spreads and higher real interest rates. And currently, the long end of the yield curve has a normal upward slope. You may also like “Why the Current Business…
What Indicators to Watch for Signs a U.S. Recession Is Coming? 1) In recent history, a recession occurs about 12 to 18 months after the spread between the 30-year and the 3-month treasury yields turns negative (red arrow). When an inverted yield curve occurs, short-term interest rates exceed long-term rates. It suggests that the long-term…