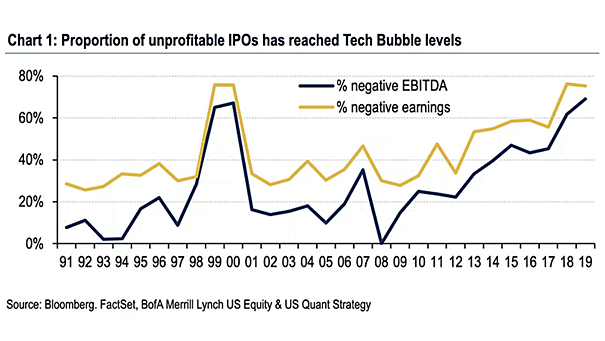
Proportion of Unprofitable IPOs
Proportion of Unprofitable IPOs The proportion of unprofitable IPOs has reached 70%, the highest level since the tech bubble 20 years ago. Image: BofA Merrill Lynch
Proportion of Unprofitable IPOs The proportion of unprofitable IPOs has reached 70%, the highest level since the tech bubble 20 years ago. Image: BofA Merrill Lynch
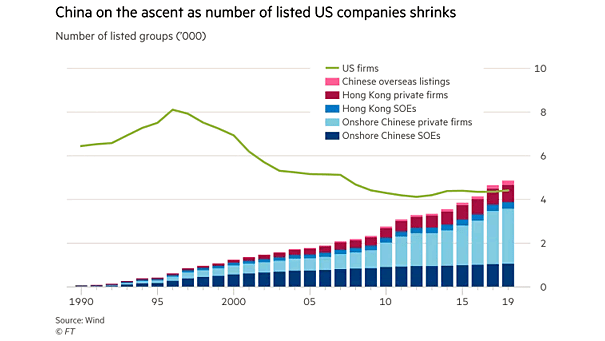
U.S. vs. China – Number of Listed Companies, IPO There are fewer firms listed on U.S. exchanges than 20 years ago. And the U.S. has also fewer listed public companies than China. Image: Financial Times

IPO Relative Performance in 2019 The IPO market is suffering in 2019. This year’s IPO class is one of the least profitable. Image: Goldman Sachs Global Investment Research
Mission Statement Level of Bullshit vs. Stock Performance from One Year Post IPO This chart suggests that the level of bullshit in the mission statement seems to be inversely correlated to the stock performance from one year after the IPO. Image: Scott Galloway
2019 U.S. IPOs 2019 is well on its way to being the biggest IPO year in recent years. Image: Goldman Sachs Global Investment Research
How IPOs Are Priced? Great chart showing how IPOs are priced. IPO stands for “It’s Probably Overpriced.” You may also like “IPOs Tend to Underperform the Market.“ Image: Safal Niveshak
Unicorn’s Performance After Their IPOs A unicorn is a privately held startup company with a value of over $1 billion. The chart below shows the value today, if you had invested $1000 at the time of the IPOs. You may also like “IPOs Tend to Underperform the Market.” Image: howmuch.net
IPOs Tend to Underperform the Market The evidence shows that, despite their higher risk, initial public offerings make poor investments. You may also like “Unicorn IPOs, Are They Good Investments?“
Unicorn IPOs, Are They Good Investments? Keep in mind that most IPOs lose money for investors after 5 years. Images: CNBC, Hedgeye Risk Management LLC
Performance – Ratio of Russell 2000 Index to Nasdaq Composite Small-cap stocks are currently at a record low relative to the Nasdaq Composite. Factors that could drive small-cap stocks to outperform include a rise in M&A and IPOs, robust earnings growth, and changes in interest rates. Image: BofA Global Investment Strategy
Why U.S. Productivity Is Lower Than Previous Business Cycles? The real yield is the most important measure of financial tightness. But as the real yield is near zero, artificially low interest rates are then associated with unnecessary debt, zombie firms and lower productivity than previous business cycles. Zombie firms cannot invest, innovate and increase productivity. …